Channel Modeling a Mobile Repeater
Paul
Hagan
Gte929u
ECE
3065
Spring 2004
Georgia Institute of Technology
College of Engineering
School of Electrical and Computer Engineering
Introduction
NTT DoCoMo is developing a system to improve service on the Shinkansen. The rail line spreads along the island of Honshu. The bullet trains are widely used in Japan with 810,000 riders every day [1]. Cellular phone reception traveling at 260 km/h is difficult due to rapid random signal strength variations. Fading introduces rapid power variations that are quite large. The train network is also routed through dense urban areas where multipath interference becomes problematic. Passing through a null in the signal pattern results in poor quality reception or even dropped calls. Coverage area and reliability is an important quality point for NTT DoCoMo. This project develops a model the received signal on a high speed train. The model should include several different circumstances including different directions to transmitter towers and variety of multipath environments. A system is being developed to use this model to compensate for rapid fading by comparing signal strength at two antennas on each side of the train. A local transceiver in the train will repeat the stronger signal to antennas in each train car. The new system promises significant improvements in cellular service on the high speed trains, an important competitive advantage.
Technical specifications
The model of mobile channel environment will be used to develop the selection diversity algorithm needed to choose antenna signals. Sampling frequency for the comparison algorithm will be recommended. The monopole antennas on the train are spaced 2m apart and operate around 1.9 GHz with existing base stations. Other specifications for this project include analyzing base stations in line and orthogonal to train movement. The Shinkansen goes through rural environments with few obstacles for radio reflections and urban or mountainous areas with wider multipath reception. These two cases are approximated by a signal distribution spread across 3° in rural areas and 120° in multipath regions. The strength of signals arriving from the direction of the base station will be weighted around the distribution of the multipath signal. Phase at the antennas is random but remains function of phase at other antenna. To model channel strength over 100ms the train moves 7.2 m.
Channel Modeling
A function was written in Matlab to model the received signal. The multipath environment is simulated with waves from all directions with Laplacian power distribution in azimuth spectrum. An equivalent Fourier signal can express the spectrum distribution equation; the Fourier coefficients were defined by the following equation.
Fourier coefficients for the spectrum are used to determine angular spread,
angular constriction, and direction of maximum fading [2]. The multipath shape factors are usefully in
describing the incoming signal. Spread
measures the angular distribution in waves around a single maximum value. Constriction measures how the distribution
is focused around two azimuthal directions [3].
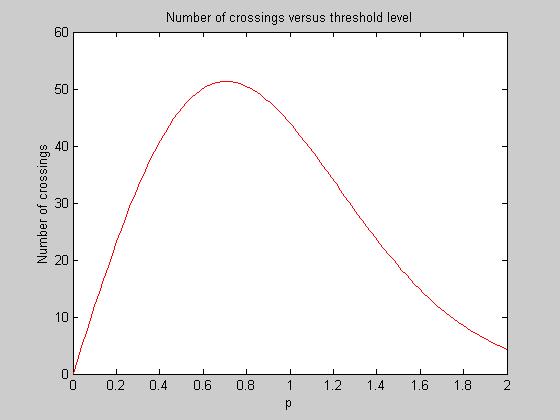
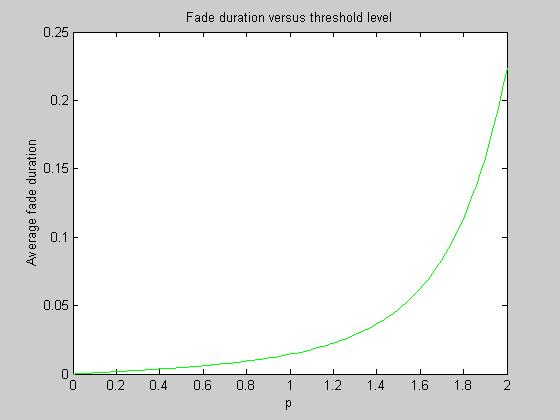
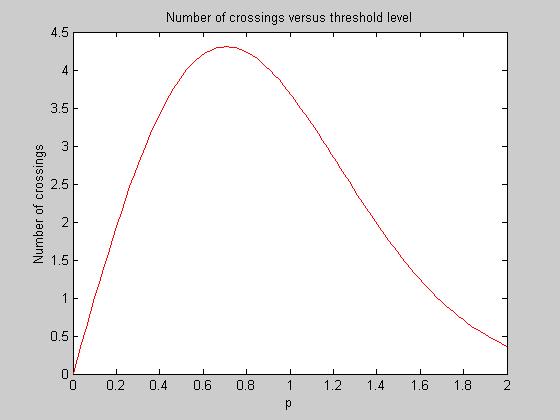
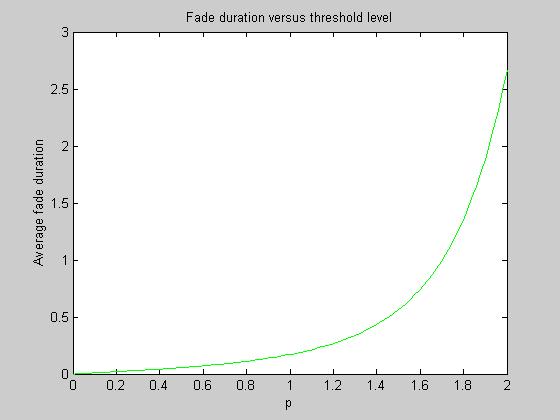
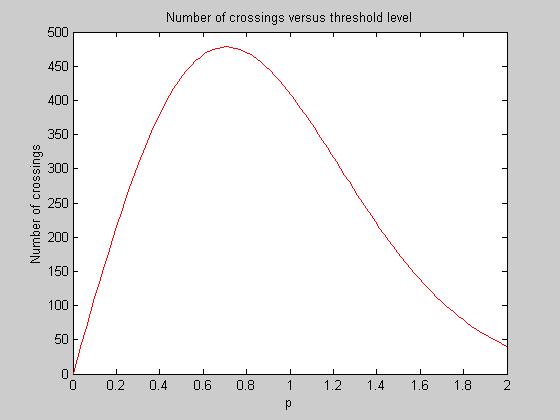
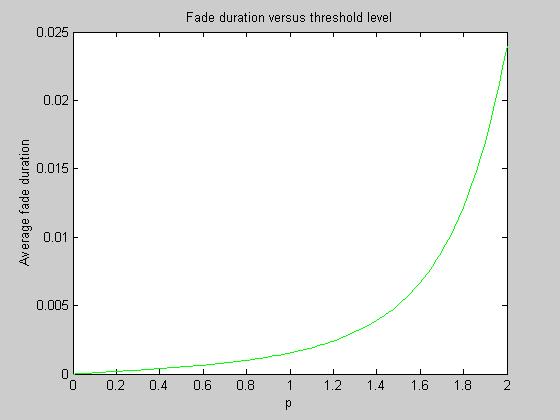
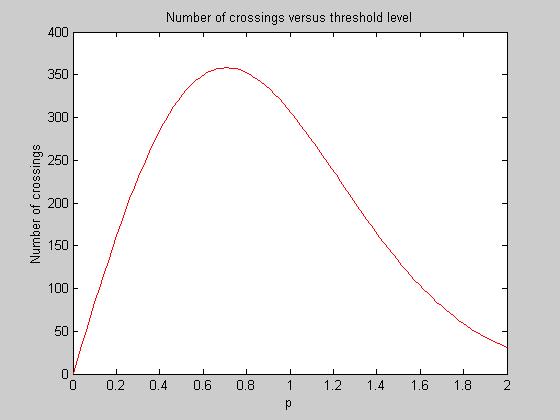
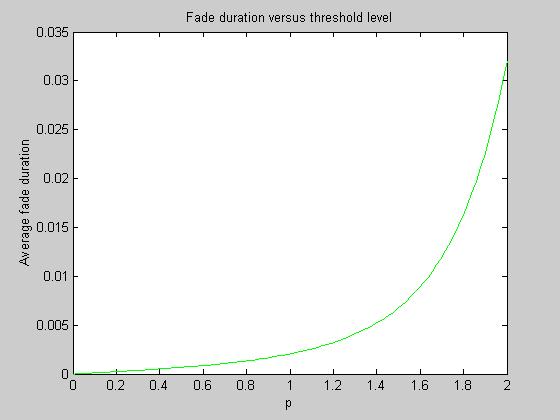
Level crossing rate of threshold level and average fade duration can be defined using these characteristics for any moving receiver in multipath environment [2]. The two equations are function of threshold value, p.
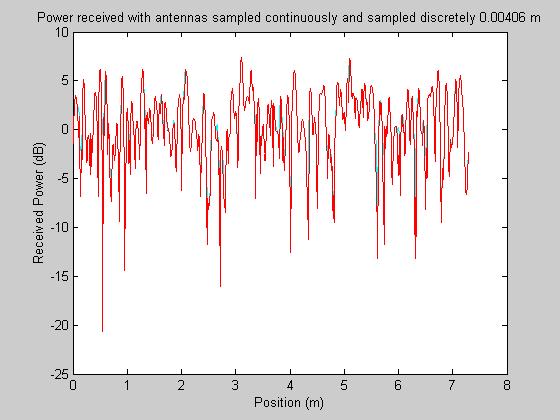
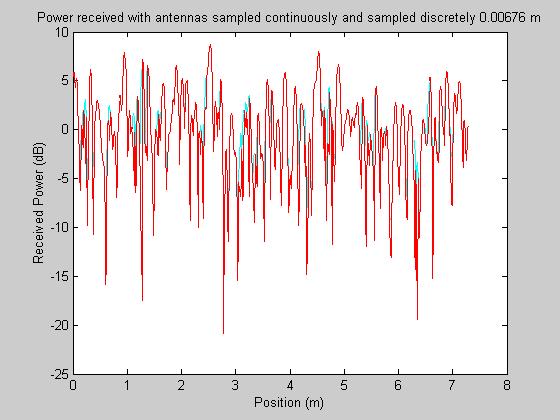
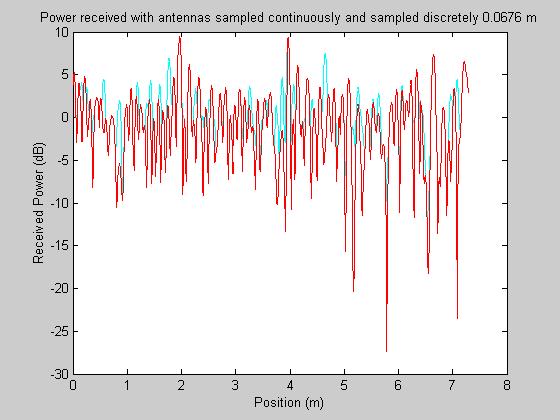
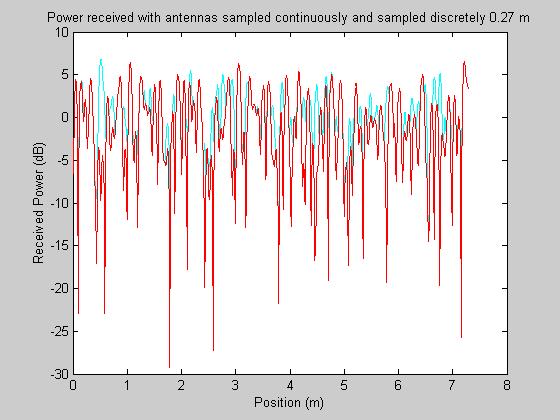
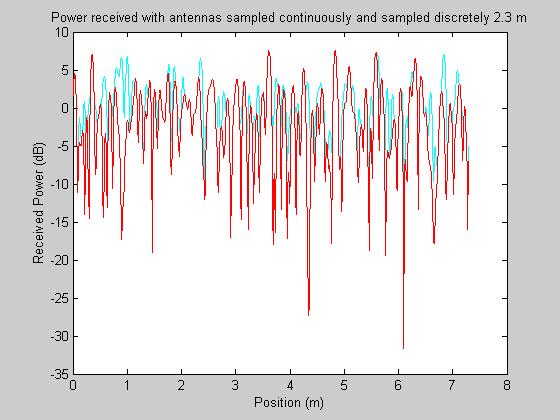
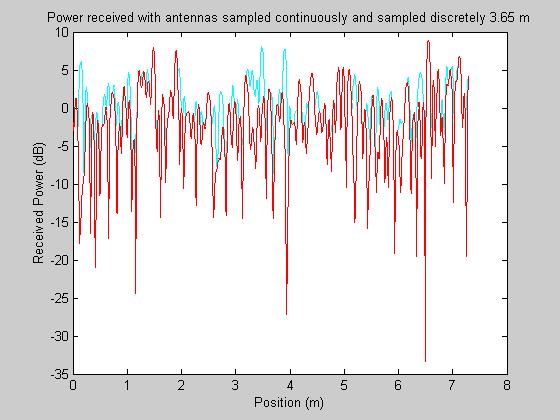
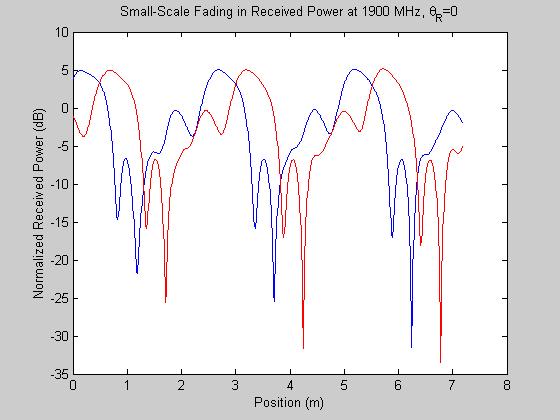
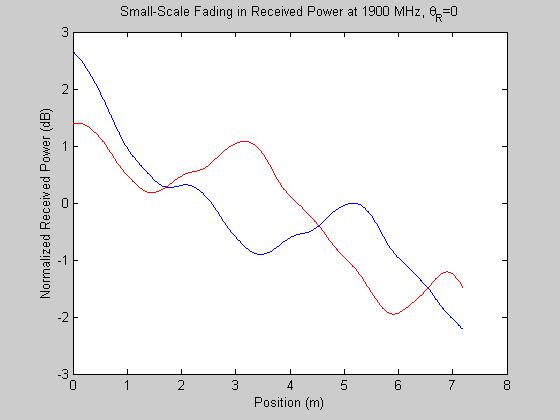
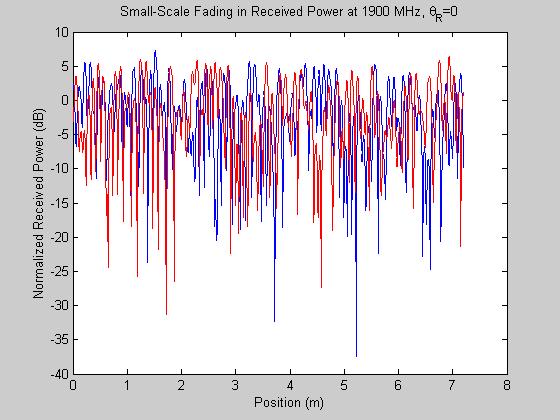
Phase relationship between antennas was defined using trigonometry and lambda. The equations were then simulated under both multipath spreads and base station directions. In determining the sampling rate of a selection diversity function between the two antennas the urban multipath with base station in line model was chosen for its highest number of level crossings and extremely rapid variations in signal strength. These random changes occur so quickly for a diversity function to offer any improvement by staying on the higher power antenna extremely fast comparisons must be made. The graphs below illustrate that sampling at lower rates lowers the average power and increases the number of deep nulls that could interrupt service. As distance between samples shrinks to below .007 m the power level tracks closely. The first graph shows excellent tracking can be achieved sampling less than .005 m in fact there is only two drops below –15dB and only few past –10dB. Traveling at top speed this would require sampling rate around 16 kHz.
Conclusion
A cellular phone repeater for the Japanese bullet train could offer significant improvements in service for NTT DoCoMo subscribers. The selection diversity functions should sample power at each antenna 16,000 times a second to ensure high reliability. If this is not practical, sampling 10,000 times a second improves performance over one antenna. Comparing antennas at slower rates than this offers little advantage to having multiple antennas. Also locating base stations along train tracks will improve reception versus trains moving perpendicular to base stations.
Rural environment, base station perpendicular to rail
Rural environment, base station straight ahead
Urban environment, base station perpendicular to rail
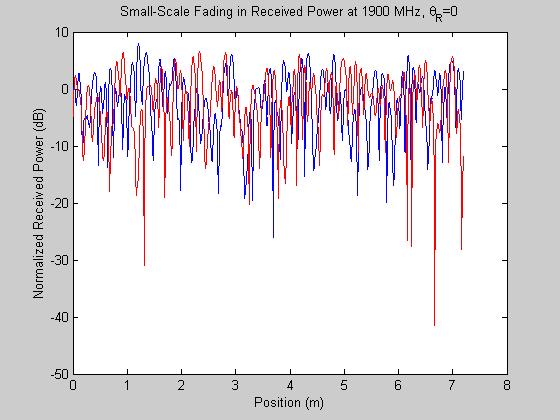
Urban environment, base station straight ahead
References
[1] Japan Railway & Transport Review, Oct 1994 http://www.jrtr.net/jrtr03/pdf/photo_00.pdf
[2] Gregory Durgin, and Theodore Rappaport, “Theory of Multipath Shape Factors for Small-Scale Fading Wireless Channels,” in IEEE Transactions on Antennas and Propagation, v. 48, n. 5, pp 682-693
[3] Space-Time Wireless Channels, Sec. 6.3, pp 157 (class notes)