|
TransmiTech
|
|
| Cell Maps: | |
|
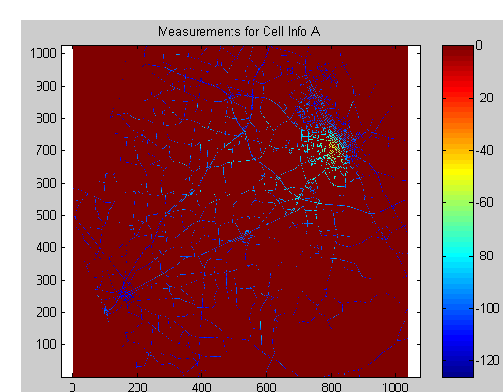
Below, we present the predictions for Cell A through D and we show their respective measured data:
Figure 3. Measured data for cell A.
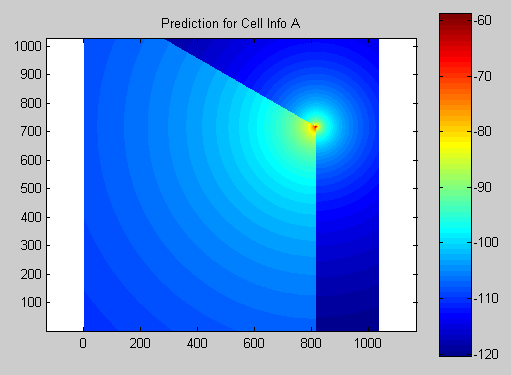
Figure 4. Predicted pattern for cell A.
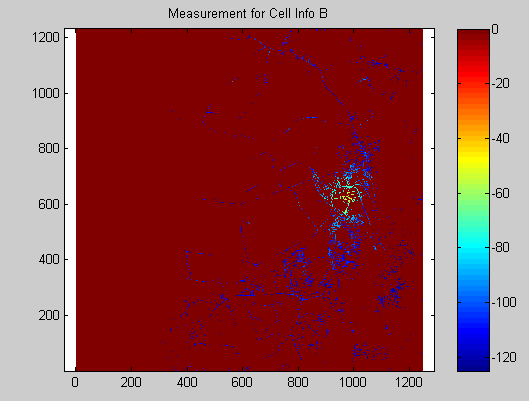
Figure 5. Measured data for cell B.
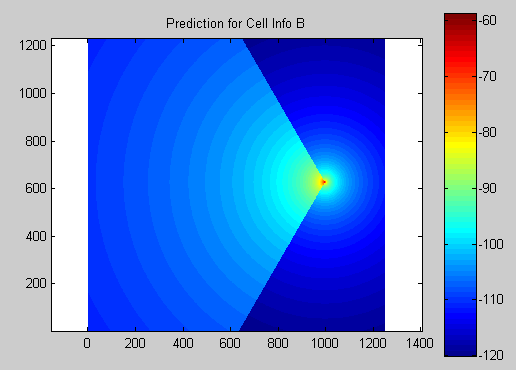
Figure 6. Predicted pattern for cell B.
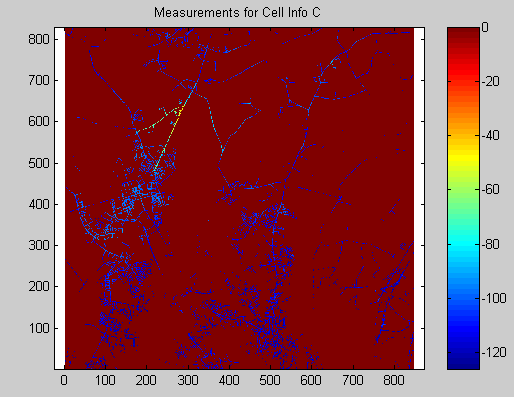
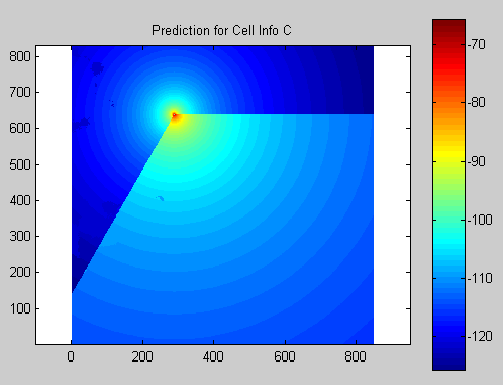
Figure 7. Measured data for cell C.
Figure 8. Predicted pattern for cell C.
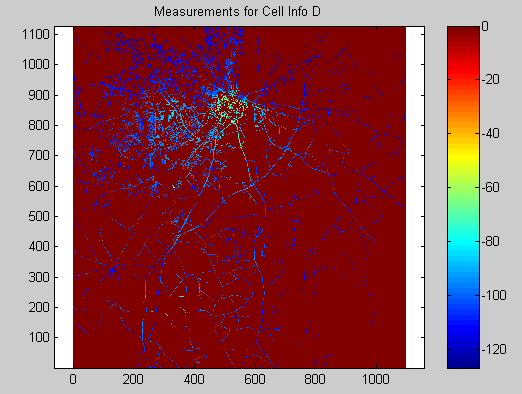
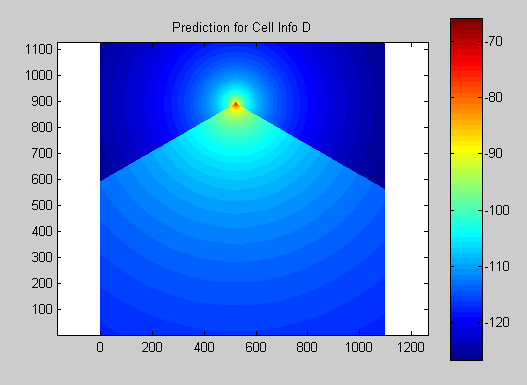
Figure 9. Measured data for cell D.
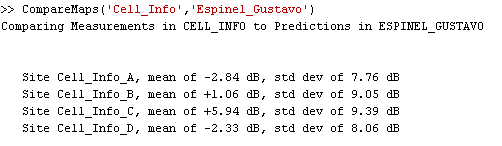
Figure 10. Predicted pattern for cell D. After completing the model for each of the previous cells, we compare our predictions with the actual measured data on each map with a special code provided by Wimaxorbust Inc., below are the results:
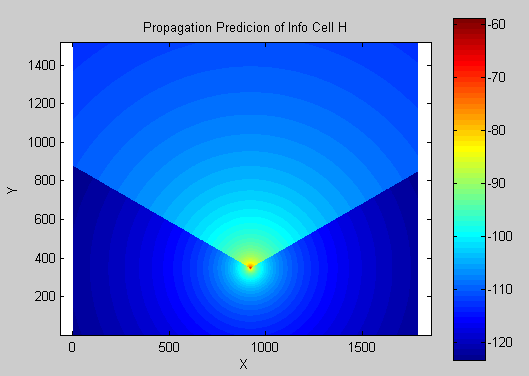
It is important to mention that this results were obtained by the use of our most simple software, the TX-2000. The results obtained with the TX-3000 and TX-4000 showed more discrepancy than our simple model. This might be explain by the complex process of calibration required in our more advanced software TX-3000 and TX-4000. Bellow, we present our prediction for the myterious cells F through H:
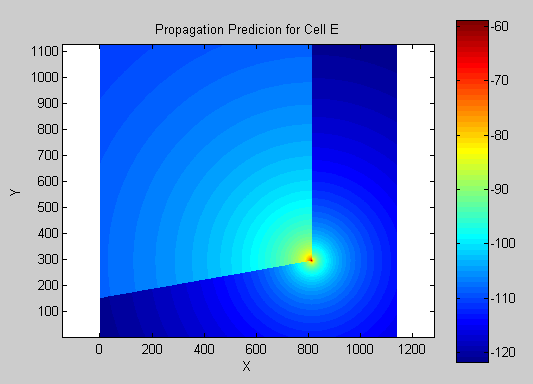
Figure 11. Predicted pattern for cell E.
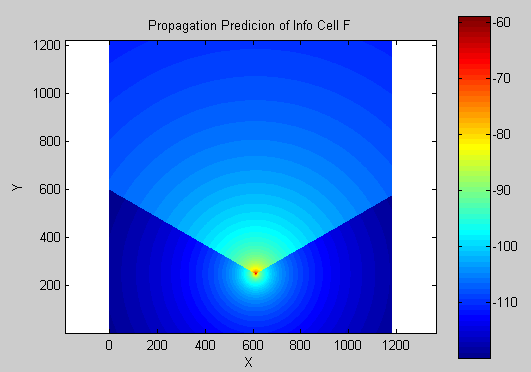
Figure 12. Predicted pattern for cell F.
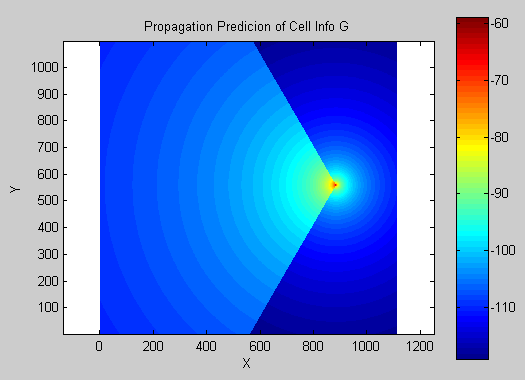
Figure 13. Predicted pattern for cell G.
Figure 14. Predicted pattern for cell H.
|
|