Appendix B: Antenna Results
Antenna B
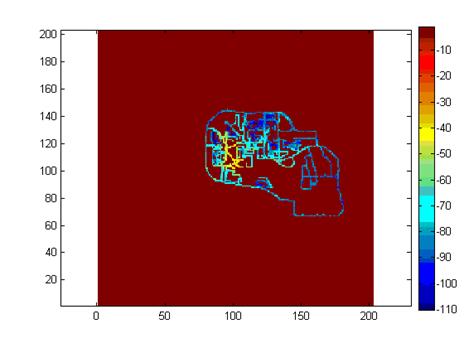
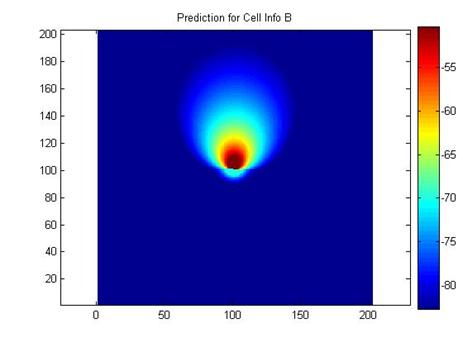
Fig. B1.
Measured power received from antenna B. Fig.
B2. Modeled power received from antenna
B.
Error at site B is 11.48 dB standard deviation and 3.42 dB
mean. The error for antenna B is a
little high for this model. Error can be
attributed not only to specificity of building and penetration loss locations,
but also to the fact that this antenna is pointing directly at an open field. The actual data reflects that there is very
low loss in the open field, corresponding to values of -40 dBm received
power. This is 10 dBm higher than the
proposed model is allowed to predict.
Antenna C
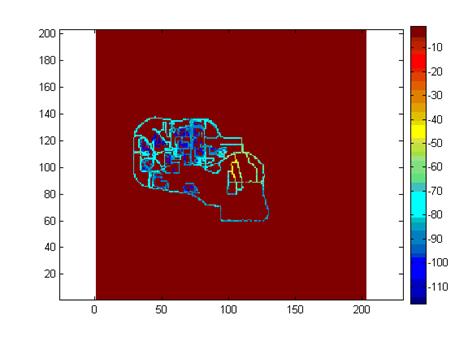
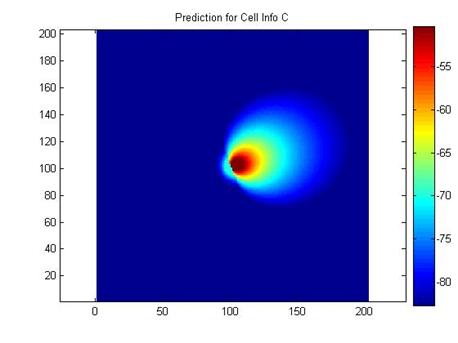
Fig. B3.
Measured power received from antenna C. Fig. B4. Modeled power received from antenna C.
Error for antenna B is 9.36 dB standard deviation and 1.38
dB mean. Error can be attributed mostly
to the immediate effects of penetration loss and shadowing, which is
unaccounted for in the model.
Antenna D
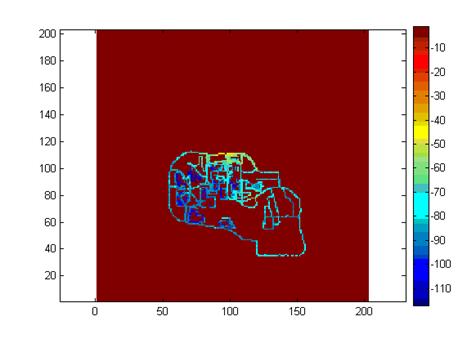
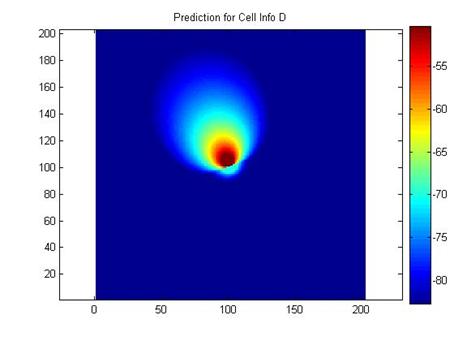
Fig. B5.
Measured power received from antenna D. Fig.
B6. Modeled power received from antenna
D.
Error for antenna D is 10.53 dB standard deviation and 2.6
dB mean. Error can again be attributed
to immediate loss effects of buildings.
The model is uniform for most of the tested region, yet still performed
with moderate error.