
Required Data Rate
three during the day, and three at nightWith our imaging system, 249,800 Gigabits of raw image data is generated per day! Each satellite will pass over or nearby the continental United States (near the two ground stations) at least six times per day (three during the day, and three at night), providing a conservative estimate of six "good" passes per day during which it can downlink data. Since the spacecraft is in LEO, each satellite can only transmit data for 10 minutes during each good pass. If the entire, uncompressed image data were transmitted each day, a data rate of 807 Mbps per second would be required! This high data rate is not possible in CubeSat communication systems.
JPEG Compression
To reduce the size of the data being transferred to our ground stations, we chose to employ JPEG compression. The following compression rates were used:
To reduce the size of the data being transferred to our ground stations, we chose to employ JPEG compression. The following compression rates were used:
- Land: 10:1 (High Quality Compression)
- Water: 50:1 (Medium Quality Compression)
- Percentage of Earth Covered in Water: 70.8%
- Percentage of Earth that is Land: 29.2%
- Percentage of Raw Data Remaining After Compression: (70.8% x 2%) + (29.2% x 10%) = 4.34 %
- Total Compressed Daily Data Size: 4.34% x 249,800 Gigabits = 10,841 Gigabits

Resulting Data Rate After Compression
A data rate of 35Mbps is much more easily attained by a CubeSat communication system. Note that this analysis provides a conservative estimate to the communication time available while still achieving whole-Earth downlink, as shown in the constellation simulation. To achieve this data rate with reasonable headroom for unforeseeable losses, the following parameters were chosen:
- Center Frequency: 8200 MHz
- Wavelength: 0.0366m
- Bandwidth: 100 MHz
Sources of Loss
In calculating our link budget, we at MARCO POLO chose to use worst-case values in determining our link losses.
Noise Power at Receiver
Physical temperatures that introduce noise at the receiver are as follows:
These temperatures are added together to form a total system noise temperature. The formula for noise due to temperature is shown below.
Physical temperatures that introduce noise at the receiver are as follows:
- LNA Temperature [1]: 55K
- Physical Temperature [2]: 290K
This temperature is a conservative measurement. Normal physical temperature would be less, but when the Sun passes in front of the receiving ground station antenna, the physical temperature is temporarily in the range of 200-300K.
These temperatures are added together to form a total system noise temperature. The formula for noise due to temperature is shown below.

Noise Power Due to Temperature
The parameters for this formula are:
- k = Boltzmann's Constant = 1.3807 E -27
- T_sys = 345 K
- B = 100 MHz
Free Space Path Loss
As a signal travels through space, it experiences some degradation due to a "spreading" effect. As the signal begins to cover more and more area, the energy at any specific point in the signal's path decreases [3]. Free space path loss is given by the following formula:
As a signal travels through space, it experiences some degradation due to a "spreading" effect. As the signal begins to cover more and more area, the energy at any specific point in the signal's path decreases [3]. Free space path loss is given by the following formula:
Free Space Path Loss Formula
The parameters for this formula are:
- r = 500 km
- Wavelength = 0.0366 m
Rain Attenuation
Rain is another source of loss in radio transmission. A signal can be partially absorbed by rain en route to its destination, thus degrading the signal quality.
The images below contain a map of the United States divided up into lettered regions by rain rate, and a table with the corresponding rain rates. The GT ground station is in region D, and the Cal Poly ground station is in region F.
Rainfall Regions [4]
|
Rainfall Rates in Percentage Time by Rainfall Region [4]
|
The formula for rain attenuation is displayed below. In the formula, "A" is attenuation in dB, "k" and "α" are given coefficients, "R" is rain rate in mm/hr, "h_rain" and "h_antenna" are the heights of the rain and antenna in km, and "el" is the elevation angle in degrees.
Rain Attenuation Formula
A table of rain coefficients is given in the following table:
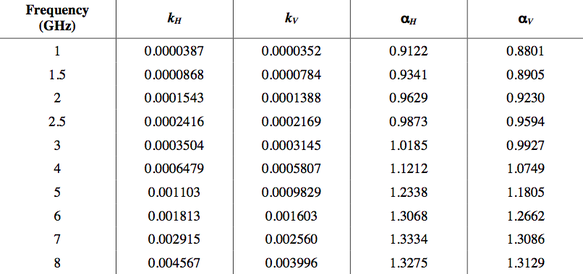
Rain Fade Coefficients [5]
Notice in the above table that the rain fade coefficients are given only for horizontal and vertical polarizations. Because our antennas use circular polarization, the following formulas must be used to calculate the correct rain fade coefficients:
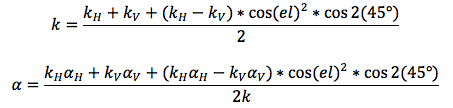
Rain Fade Coefficients for Circular Polarization [5]
The parameters for this formula are:
- el = 5 degrees
- h_rain = 1.925 km [4]
- h_antenna = 0 km
Other Losses
Other losses added in to our link budget in order to be conservative include the following:
The values for these losses are included in the Link Budget section.
Other losses added in to our link budget in order to be conservative include the following:
- Antenna Beam Edge Loss
- Atmospheric Air Loss
- Other Unforeseeable Losses
The values for these losses are included in the Link Budget section.
Link Budget
Performing all of the calculations described above gives us the information needed to calculate the link budget of our downlink. Note that separate calculations for the GT and Cal Poly ground stations are not necessary due to the rainfall rate and height being the same at both locations.
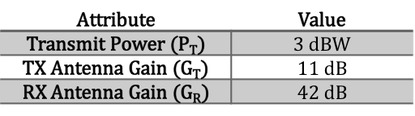
Downlink Power and Gains
|
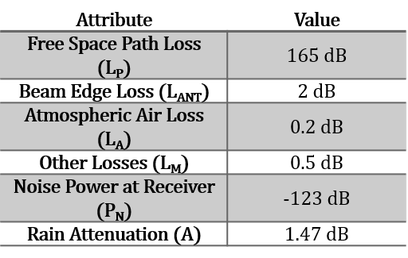
Downlink Losses
|
Using the values in the tables above, we can calculate the signal-to-noise ratio (SNR) of the downlink signal received at the ground stations. The SNR is given by the formula shown below. Note that the Temperature Noise is the noise received at the ground station. Without this value in the calculation, the result would be the signal power received at the ground station rather than the SNR.

Signal-to-Noise Ratio Formula
From the SNR, we can calculate the bit error rate and Shannon channel capacity (SCC). The formulas for both attributes are shown below.
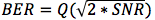
Bit Error Rate Formula
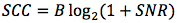
Shannon Channel Capacity Formula
Solving the above equations results in the following values:
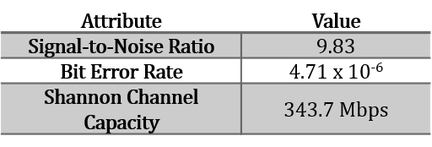
Downlink Attributes
Our link budget calculations show that with the given SNR, the bit error rate is sufficiently low and the theoretical maximum bandwidth is sufficiently high in order for a complete set of data to be reliably transferred from our fleet to our ground stations each day. Reaching the theoretical maximum bandwidth has been a challenge for communications engineers for a long time, but because we require a minimum downlink of only 35Mbps, our downlink channel is sufficient.
References
[1] - http://www.miteq.com
[2] - http://www.mike-willis.com/Tutorial/PF13.htm
[3] - http://www.radio-electronics.com/info/propagation/path-loss/rf-signal-loss-tutorial.php
[4] - http://www.philsrockets.org.uk/Rain%20Fades.pdf
[5] - https://www.itu.int/dms_pubrec/itu-r/rec/p/R-REC-P.838-2-200304-S!!PDF-E.pdf