mean error: -2.67 dB
std deviation: 12.14 dB
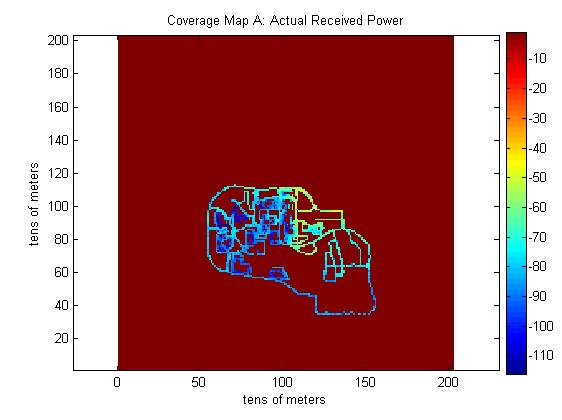
Figure 1. Actual received power data for Map A provided by Springularizon.

Figure 2. Predicted received power data Map A, as generated from our model.
Map B
| cellID: | '308901' |
| base station coordinates (lat,lon): | 33.7746, -84.4002 |
| antenna: | '7860.02ET' |
| azimuth: | 2 degrees |
| tilt: | 0 degrees |
| transmit power: | 40 |
| effective radiated power: | 37.9934 dBm |
| frequency of operation: | 850 MHz |
| coordinates of upper left corner: | 33.7840, -84.4108 |
| coordinates of lower right corner: | 33.7653, -84.3895 |
mean error: +6.27 dB
std deviation: 11.02 dB
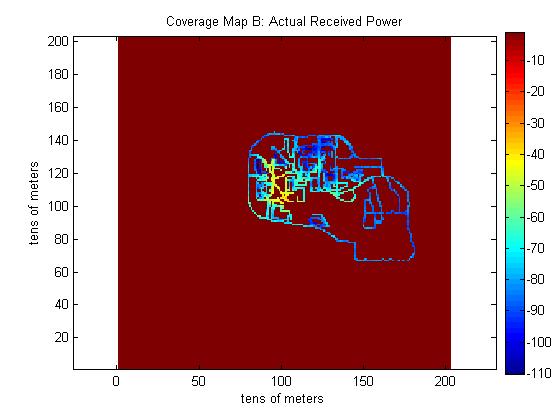
Figure 3. Actual received power data for Map B provided by Springularizon.
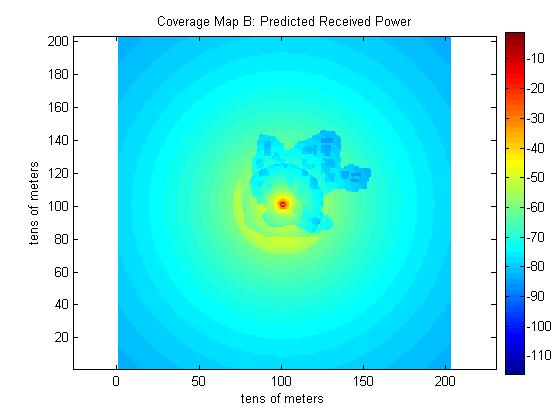
Figure 4. Predicted received power data Map B, as generated from our model.
Map C
| cellID: | '309201' |
| base station coordinates (lat,lon): | 33.7751, -84.3946 |
| antenna: | 'ALP8010 N' |
| azimuth: | 70 degrees |
| tilt: | 0 degrees |
| transmit power: | 40 |
| effective radiated power: | 25.0515 dBm |
| frequency of operation: | 850 MHz |
| coordinates of upper left corner: | 33.7845, -84.4052 |
| coordinates of lower right corner: | 33.7658, -84.3840 |
mean error: -3.32 dB dB
std deviation: 12.87 dB
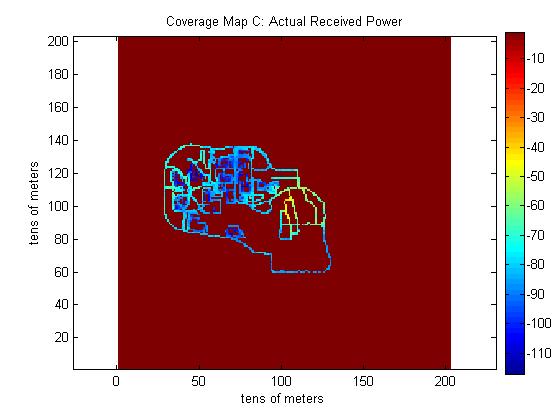
Figure 5. Actual received power data for Map C provided by Springularizon.
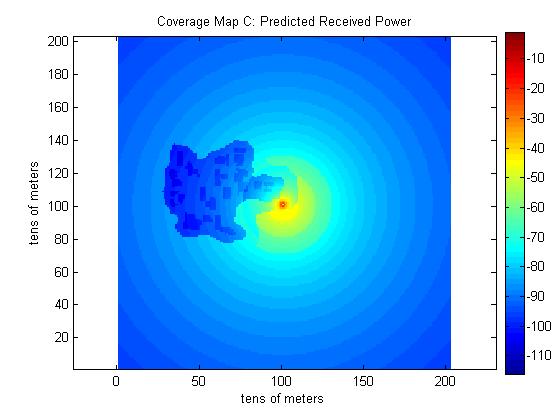
Figure 6. Predicted received power data Map C, as generated from our model.
Map D
| cellID: | '307801' |
| base station coordinates (lat,lon): | 33.7774, -84.3974 |
| antenna: | 'FV65-11-00_A2' |
| azimuth: | 340 degrees |
| tilt: | 0 degrees |
| transmit power: | 40 |
| effective radiated power: | 25.0515 dBm |
| frequency of operation: | 850 MHz |
| coordinates of upper left corner: | 33.7868, -84.4080 |
| coordinates of lower right corner: | 33.7681, -84.3867 |
mean error: +0.46 dB dB
std deviation: 10.62 dB
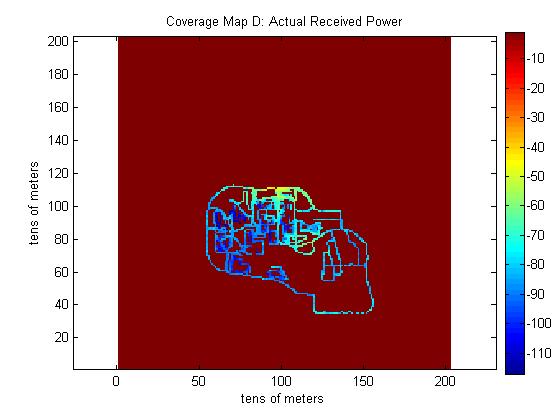
Figure 7. Actual received power data for Map D provided by Springularizon.
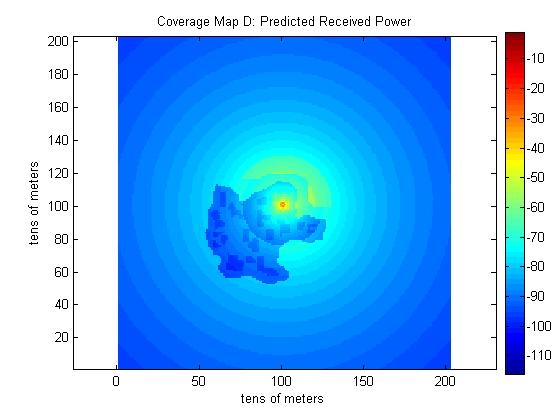
Figure 8. Predicted received power data Map D, as generated from our model.