After applying the the discussed methods of propagation modeling to a set of four sample regions the success and limitations have become evident. Below is a map showing distance and terrain for which the signal was modeled. Below that is the corresponding measured data in dB.


Below is the propagation model for this region where every single pixel (a 30mx30m area) has been assigned an estimated received power. A note of clarification, every where in the above diagram where 0 is displayed merely indicates that no measurements were taken. Those points will not be taken into consideration for the mean and standard deviation measurements.

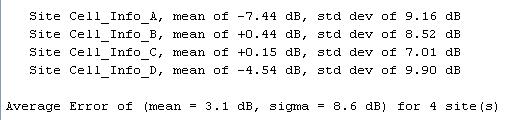
While difficult to tell from the picture, the model has returned extremely reasonable results. Only one region has been shown, but the data below shows the mean error and the standard deviation.
The practicality of this model and economics of this model are specific to the needs of the devices that will be using the microwave signal. This model can accurately model signal propagtion, but as seen in the standard deviation, preciseness may be an issue. This issue will especially present itself with devices such as cell phones where even the slightest change in signal strength could cause a distuption in service. In addition, it is likely that for any given region, there will be more than one transmitter antenna to receive signal from. This model currently only supports one transmitter.
This model will provide a basic estimate of the effects of adding a transmitter to the area. It is intended to determine whether providing microwave radio signal to a given region would be feasible. For any corporation this model would provide an incredibly cheap, fast, and easy way to determine whether it is worth their while to pursue offering microwave signal to an area. It could be modified to provide more precise information, but to do so would cause the cost of the modeling and the computing time to increase exponentially.