| |
|
|
 |
     |
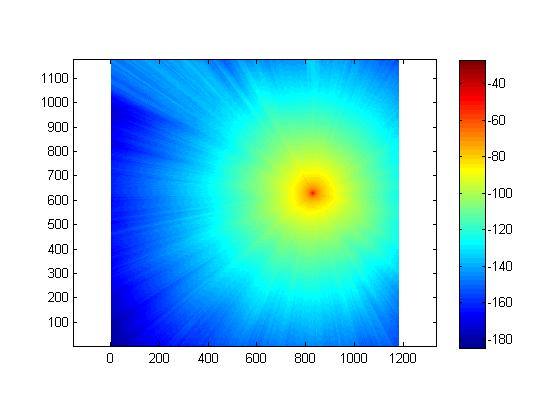
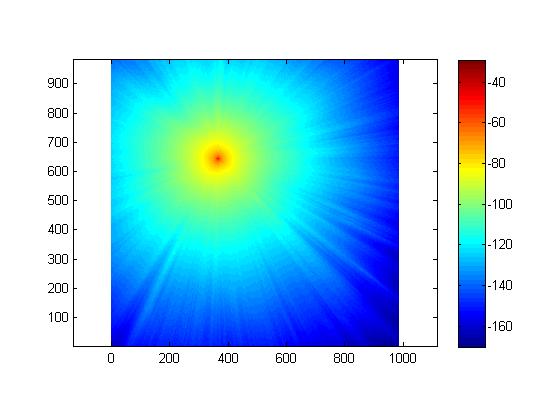
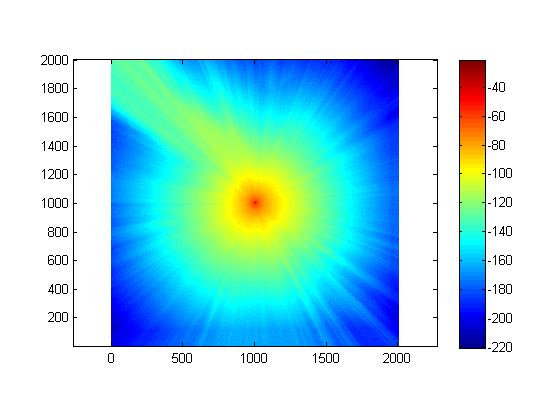
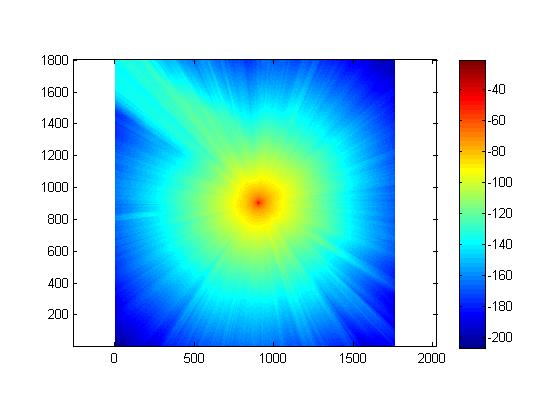
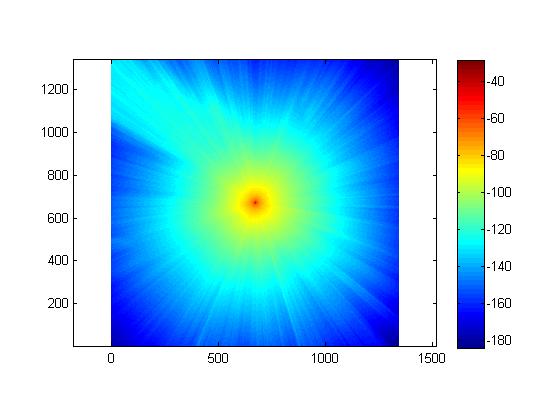
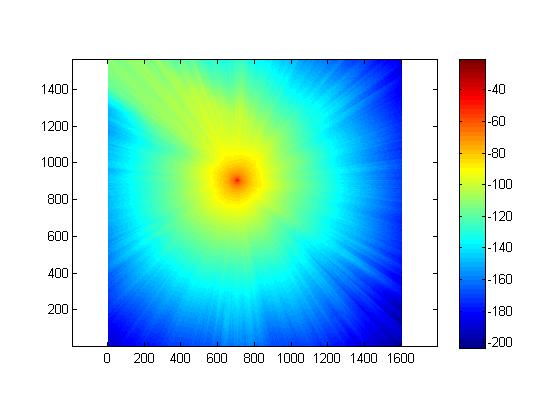
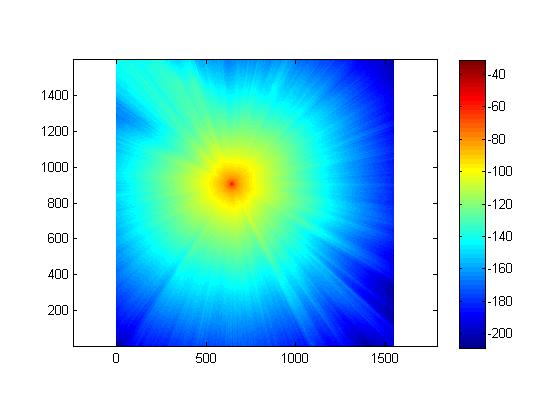
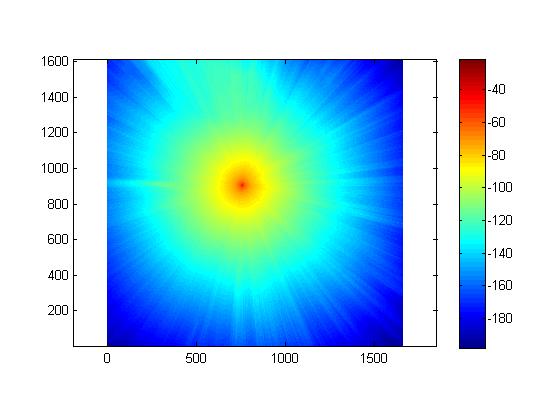
Shown below are the results from
our propagation modeling technology. For cell sites A-D,
we had access to real measured data at some points on
the maps, and thus we were able to compare the results
from our propagation model against them. The mean error
and standard deviation are shown for cell sites A-D.
Since we did not have access to real measured data for
cell sites E-H, we cannot calculate the accuracy of our
propagation model.
|
Cell Site A |
Mean =
-4.34 dB |
Standard Deviation = 9.31 dB |
 |
|
Cell Site B |
Mean =
6.14 dB |
Standard Deviation = 11.16 dB |
 |
|
Cell Site C |
Mean =
-3.96 dB |
Standard Deviation = 9.57 dB |
 |
|
Cell Site D |
Mean =
2.16 dB |
Standard Deviation = 10.84 dB |
 |
| Cell Site E |
 |
| Cell Site F |
 |
| Cell Site G |
 |
|
Cell Site H |
 |
|
|
|