The
communications system
I.
The
intrinsic data
1)
It is only
reasonable to start by gathering
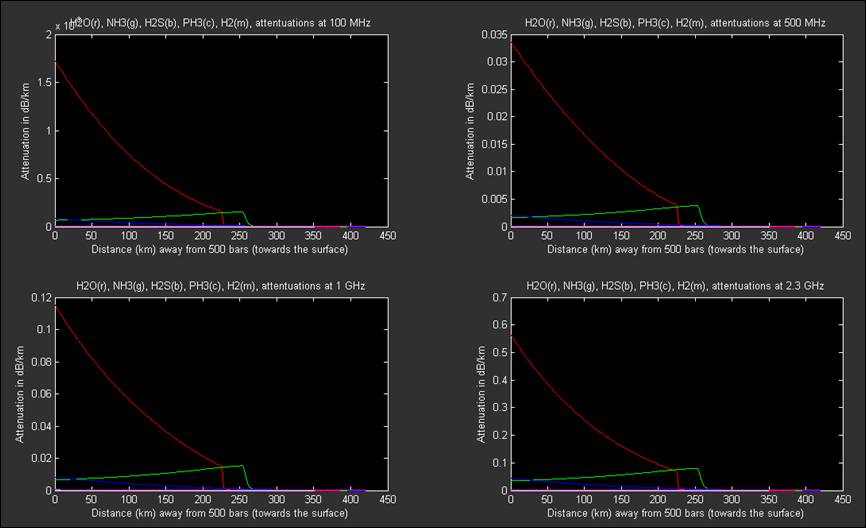
Figure 1.
The main point to notice is that water is the predominant absorbent in the
atmosphere.
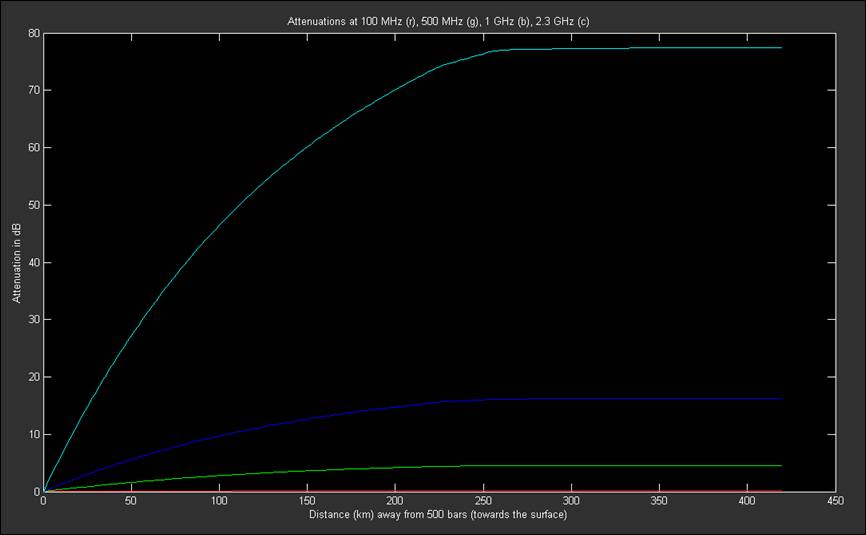
Figure 2. Attenuations at
four different frequencies.
The above
plot shows the attenuation at four different frequencies calculated from the
provided data. A simple (or simplistic?) approach would be to linearly
interpolate this data to obtain attenuation values for all frequencies ranging
from 100 MHz up to 2.3 GHz, thus covering VHF,
UHF, L-Band and S-band.
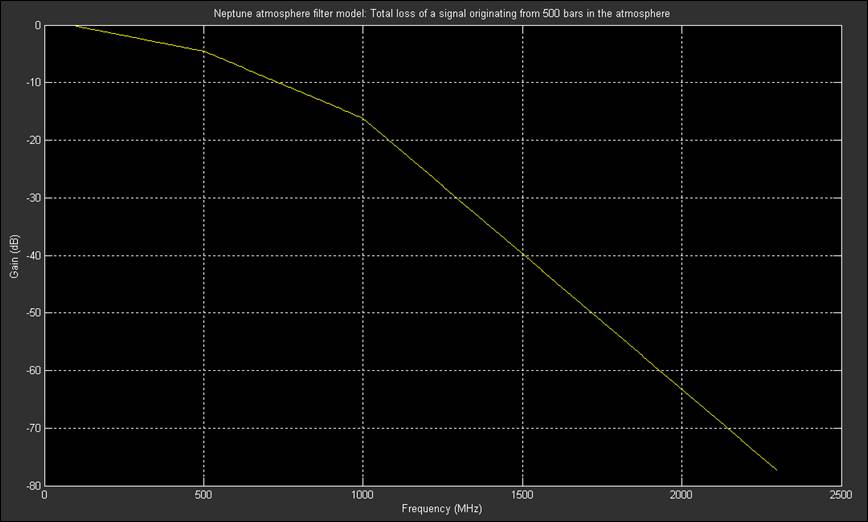
Figure 3. Filter equivalent
of
The above
plot shows the total attenuation at frequencies ranging from 100 MHz to 2.3
GHz. This is the attenuation of a signal originating 500 bars inside
2) System requirements
The only
constraint enforced is that data is to be transmitted from the probes back to
Earth at 8kbps per probe. The orbiting satellite will serve as a repeater that
will regenerate the data and amplify it enough for it reach Earth. It will
receive three signals at 8kbps each. The most obvious modulation scheme to use
would be a BPSK signal carried on to the best frequency that will satisfy
electronic components availability as well as Carrier to Noise considerations.
For multiple access, Frequency Division Multiple Access (FDMA) will be used,
mainly because it is simple, and frequency occupation in deep space is so
sparse that we do not need to worry about inefficiency of the spectrum usage.
Using a raised cosine pulse shape with a roll-off factor of 0.5, the frequency
occupancy of each probe will only be 12 kHz.
II.
System
design
1) Downlink between relay satellite and Earth
The
antenna on Earth (Deep Space Network) is a 34m dish antenna with a noise
temperature of 20°K and aperture efficiency of 0.94. The gain of this antenna
is given by:
![]() , (1)
, (1)
The only
value that is unknown at this point is the wavelength. What is the carrier
frequency of the signal generated from the relay satellite orbiting around
-
S-band (2.1 to 2.3 GHz): The S-band is attractive
because of the availability of commercial components, the existing frequency
allocations for near-Earth and deep space.
-
X-band (7.2 to 8.5 GHz): X-band is attractive because
of the existing near-Earth and deep-space frequency allocations and because
on-board hardware could easily be shared for both the deep space and local
links. The biggest concern is potential self-interference during simultaneous
Direct-To-Earth (DTE) and local-link communication passes.
-
Ku-band (14.5 to 17.1 GHz): The Ku-band is attractive
because of the availability and technology maturity of components from the
commercial satellite industry and because it will not cause any interference
with the DTE links.
-
Ka-band (32 to 34 GHz): The Ka-band provides a very
large bandwidth and potentially large EIRP and G/T, but it requires
fine-antenna-pointing control, making this a less viable option for deep space
missions where a small drift of could steer the beam off the Earth antenna.
Also, there is not the hardware maturity and availability of the other
frequency bands.
The
choice of the frequency band depends on the amount of transmit power available
at both ends (Satellite and antenna), as well as the receivers’ sensitivities.
To get an idea of the Earth antenna sensitivity, we will do a back of envelope
calculation:
The
system temperature of the Earth antenna pointing at
![]() ,
,
Let’s do a calculation for a carrier in
the X-band and in Ku-band and compare:
The
received power at the Earth antenna is:
![]() , (2)
, (2)
How much power can a
satellite transmit? Referring to the electric
power system page, a solar array can provide as much as 800W of total power
to the entire satellite. Cassini was able to transmit 20W of RF power, not
taking into account the high gain antenna. Using a High Gain Antenna (HGA), the
typical gain is above 20 dB, thus the Effective Isotropic Radiated Power (EIRP)
of a satellite is then roughly 50 dBW. The maximum distance of
![]()
We can see that we
will need a lot of error correction encoding gain in order to obtain a low bit
error rate (BER). However, the best possible encoding scheme is a Turbo Code,
which can only provide 10dB of coding gain. Hence, the X-band does not provide
sufficient power at the receiving Earth antenna. Let’s do the same calculations
for Ka-band:
![]() For the Ka-band, the gain of the Earth antenna is calculated
from (1) to be 80 dB. In the Ka-band, the satellite is able to provide up to
100W of RF power, or 20dBW. The new signal-to-noise ratio received at the Earth
station is:
For the Ka-band, the gain of the Earth antenna is calculated
from (1) to be 80 dB. In the Ka-band, the satellite is able to provide up to
100W of RF power, or 20dBW. The new signal-to-noise ratio received at the Earth
station is:
![]() -155 + 170 = 15dB
-155 + 170 = 15dB
As we can see, the
gain obtained from a higher frequency is higher than the increase of path loss.
Clearly, we have a much better signal to noise ratio. This will allow us to
transmit data at a maximum rate given by
![]()
For B = 36 KHz, Br =
181 kbps, which is more than what we need (24 kbps).
Conclusion:
Using the Ka-band
for downlink is the best solution.
2) Uplink between the DSN dish and the Satellite
The uplink link
budget differs greatly from the downlink due to the fact that much more power
is available at the DSN dish. With a transmit power of 500 kW, and using an uplink
carrier frequency of 8 GHz in the X-band, the received power at the satellite
receiver is ![]() . The receiver noise power, for a total system temperature of
60°K, is given by kTB. The uplink data only serves for remote control purposes,
and thus is not required to be extremely fast. 1kbps are enough. Preceded by a
raised cosine filter with a roll-off factor of 0.5, the final bandwidth
occupancy is 15 kHz. Hence, the receiver’s noise power is
. The receiver noise power, for a total system temperature of
60°K, is given by kTB. The uplink data only serves for remote control purposes,
and thus is not required to be extremely fast. 1kbps are enough. Preceded by a
raised cosine filter with a roll-off factor of 0.5, the final bandwidth
occupancy is 15 kHz. Hence, the receiver’s noise power is
![]() ,
,
The received signal to noise ratio at the
satellite receiver is then:
![]() -119 + 170 = 51 dB
-119 + 170 = 51 dB
Cleary, the signal
to noise ratio is more than enough, even in the X-band.
3) Conclusion for satellite-Earth link
Due to the low power
available at the satellite’s transmitter, we must compensate this by using a
very high carrier frequency that will output a very high gain antenna. Thus,
the Ka-band must be used.
For the uplink, the
Earth dish antenna has an extremely high gain, but also a lot of transmit power
available. X-band is more than enough to receive a good signal to noise ratio
at the satellite.
A commercial
transponder capable of fulfilling the above requirements has been found at General
Dynamics. The specifications of the transponder can be found here.
A Ka-band antenna can also be found here. Moreover,
both a Ka-band upconverter and a downconverter are
needed for downlink and uplink respectively.
4) Probes to satellite links
a) Uplink and Downlink
A very
good start in designing a probe-satellite communication link is to compare with
existing designs. An example is the Mars rover-Satellite link illustrated
below.
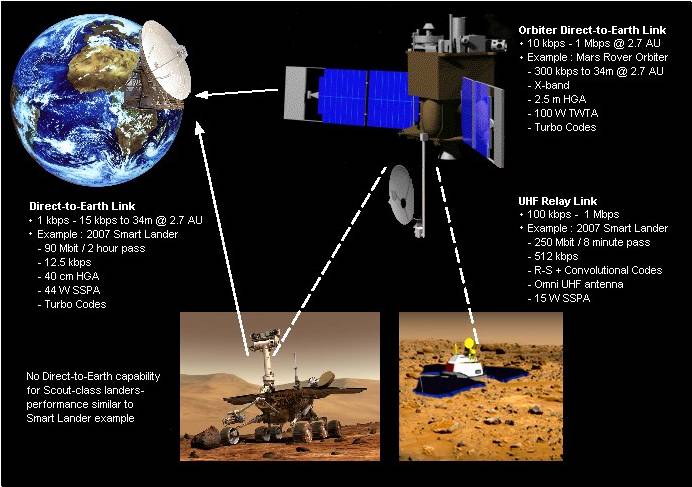
The main difference
between the Mars mission and the Neptune mission is the solar power
availability. Neptune is much further away from the Sun than Mars. However, the
probes could generate their power by making use of the extremely high
temperature within Neptune’s atmosphere. A probe can be expected to generate a
few watts at least (about 10 to 15W).
b)
Choice of frequency and antennae
Referring to the absorption data of
Neptune, a carrier frequency in the UHF band appears to be the most
suitable for uplink and downlink communication. The antenna is required to have
a large beamwidth so that as the orbiter flies by from horizon to horizon, a
communication link can be established. A recently designed crossed-slot patch antenna will be used. The antenna
offers a wide beam of about 100° and a peak gain of about 4.5 dB at 410 MHz.
Using the same antenna on the orbiter, let us perform a link budget
calculation:
An
antenna pointing at Neptune sees a temperature of about 200°K at 400 MHz. The
orbiter is roughly 800 km away from the probe. The link budget is then:
![]()
At 400 MHz, we can
assume that the attenuation curve is flat for a 36 kHz bandwidth signal. The
attenuation of a signal originating 500 bars inside the atmosphere is only 5
dB. Thus the total received power at the satellite’s receiver is:
![]()
The receiver noise
power for a 36 kHz bandwidth is:
![]()
Hence, the signal to
noise ratio at the receiver is:
![]() 31.6 dB
31.6 dB
We can see that using
the appropriate combination of antenna and frequency, we can achieve an
excellent margin of signal to noise ratio that will guarantee virtually error
free transmission with proper encoding.
5)
Frequency Division Multiple Access
Since three probes are
to be communicating data to the orbiter, they need to have a multiple access
scheme in order to avoid interference. FDMA is the most obvious and efficient
multiple access scheme that can be used in a deep space environment where
little or no concurrency over frequency allocations is present. Taking into
account guard bands for prevention against Doppler Shift, one can imagine
a frequency band allocation pattern as illustrated below:
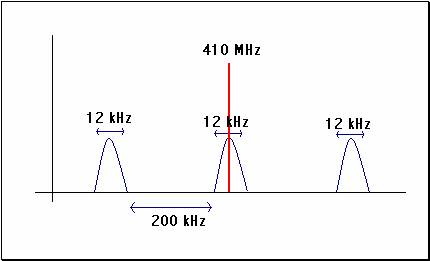
Figure 4. Frequency allocation for each probe
This pattern will be
received at the orbiter and upconverted to a
Ka-band carrier at 30 GHz for downlink transmission back to the DSN.
However, some on-board processing is required to regenerate a “clean” version
of the data, thus eliminating residual noise before transmission. This prevents
the noise from propagating and adding up at the DSN dish.
6) BPSK modulation
BPSK is the most
common modulation used in satellite links, especially for such low bit rates (a
few tens of kHz). A BPSK modulator incorporated into a full IF transceiver
has been found at Spacelink. The unit is fully based on digital signal
processing for modulating and demodulating. It also integrates a Doppler effect
compensator.
7) Encoding
Encoding is
necessary to guarantee a very low BER. We cannot afford losing data because the
probes will only acquire for 25 hours and there is no second chance. With the
receiver carrier to noise ratio calculated above, and using either a Turbo or a
convolutional codec, we can achieve extremely low bit error rates.
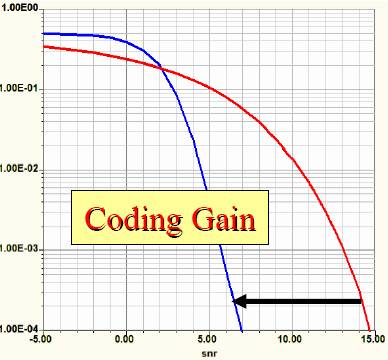 A convolutional
coder (blue) with a code rate R = 1/3 and a constraint length L = 7 has a
coding gain of up to 7 dB, bringing the effective C/N ratio to 22 dB on the DSN
dish. The gain on the satellite UHF receiver increases to 38 dB, which will
guarantee excellent data integrity. At worst, if the probe is deep into the
atmosphere and the satellite is at +90° from the probe, we can expect the C/N
ratio to drop to 15 dB, but the BER remains as low as 10-8.
A convolutional
coder (blue) with a code rate R = 1/3 and a constraint length L = 7 has a
coding gain of up to 7 dB, bringing the effective C/N ratio to 22 dB on the DSN
dish. The gain on the satellite UHF receiver increases to 38 dB, which will
guarantee excellent data integrity. At worst, if the probe is deep into the
atmosphere and the satellite is at +90° from the probe, we can expect the C/N
ratio to drop to 15 dB, but the BER remains as low as 10-8.
< Back to System Overview Next
> Orbital Mechanics