3.0: Satellite to Probe Link
The link form the probes is the most crucial link in the design. There will only be one set of probes dropped and data retrieval is time sensitive. These restraints make it imperative that the link be strong enough to account for the unexpected.
3.1 Atmospheric Attenuation
The losses due to Neptune's atmosphere are given in spreadsheet form
here
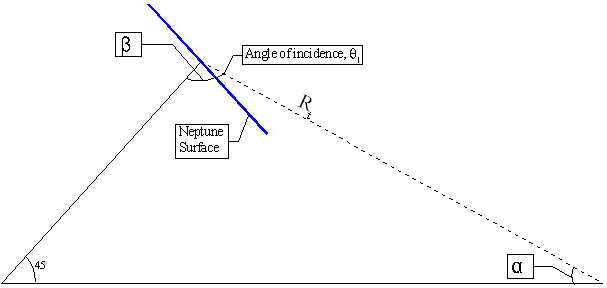
. To design for the worst case of transmission between the probes and and the relay satellite the geometry between the two must be examined. The information from
section 2.3
will be used to calculate for transmission losses from the probe to the satellite when it is on the 450 latitude line of Neptune and 420km below its surface.
The losses through the atmosphere are determined by the angle of incidence between the transmitter and receiver. With the distances involved the surface of Neptune is approximately a plane so the angle of incidence can be calculated with the figure above.
The angle of incidence for the worse case:
The distance traveled through the atmosphere in terms of the depth into the atmosphere can be obtained through geometry as well.
Distance traveled through atmosphere worse case:
The transmission will travel almost twice as far through the atmosphere when the probe reaches the depth of D=420km.
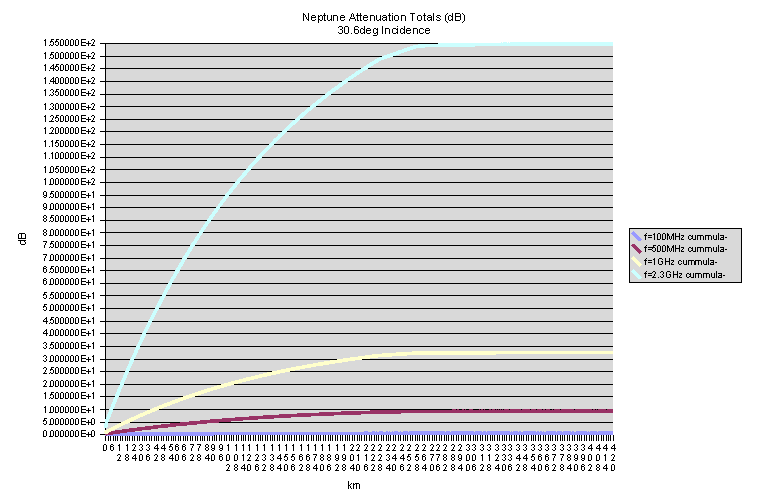
The
spreadsheet
was used to calculate the attenuation for a 00 and 30.60 incidence. The worst case of attenuation is shown above. For the best tradeoff between antenna gain, directionality, and attenuation the carrier frequency of 500MHz is chosen for the probes. This attenuation peaks at 9.12dB at the depth of 420km at an incidence angle of 30.60. The attenuation of the signal while the probe is at 420km and on the equator of Neptune also needs to be noted, 4.64dB.
Probe carrier frequency and wavelength:
Worst Case 450 latitude attenuation and its linear equivalent:
Worst case equatorial attenuation and its linear equivalent:
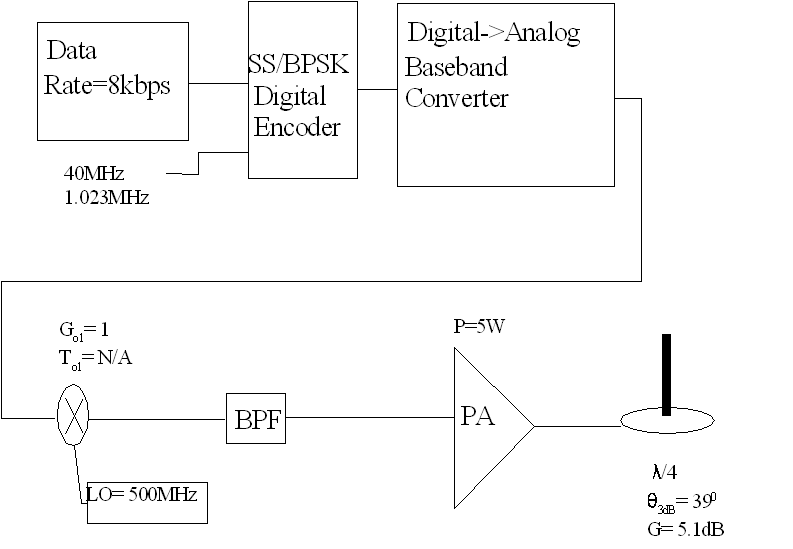
3.2: Probe Communications
Spread Spectrum/ Bipolar Phase Shift Keying Digital Encoder
Data sheet:
Comblock COM-1012
Data sheet:
Epson EG-2121CA PECL
The mission statement calls for three probes that will broadcast simultaneously. There needs to be a multiple access scheme. For this link spread spectrum will provide the multiple access. A BPSK signal will carry the 8kbps signal and be spread with a chipping rate of 1.023Mcps. BPSK modulation was chosen since QPSK looses its bandwidth benefit once its spread out by the chipping sequence.
The COM-1012 will take in digital data and output a quantized signal that has been signal processed to have a raised cosine square root response. The chipping rate is selectable and set to 1.023Mcps with a gold code sequence. An analysis of the filter is given in the COM-1012 data sheet and for a 20% roll-off factor. The reference clock of 40Mhz and the chipping frequency of 1.203MHz is provided by the EG-2121CA PECL high stability oscillator.
Digital->Analog Baseband Converter
Data sheet:
Comblock COM-2001
This module is directly compatible with the COM-1012 and will output an analog signal at baseband. The 40MHz clock will be passed through by the COM-1012 to be used as the sampling frequency. The 6 pole Butterworth Filter used by the COM-2001 will not attenuate the baseband signal, but will eliminate the higher harmonics caused by the digital sampling process.
Bandwidth of SS/BPSK Encoder and Baseband Converter
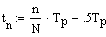
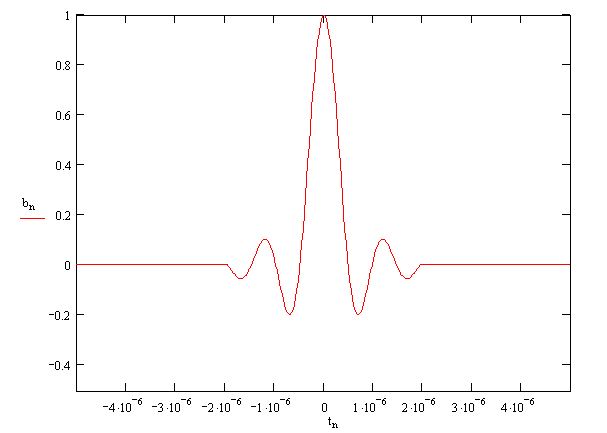
The bandwidth of this combination can be obtained by looking at the raised cosine pulse shape when it has a 20% roll off. An assumption has to be made about the length of the raised cosine pulse that can be produced by the COM-1012. For this analysis the conservative guess of 4 bit periods of pulse can be supported per data bit. The bandwidth will be determined by the first null in the power spectrum at or below 50dB down. This is a strict requirement, but will make sure a safety factor is incorporated into the calculations. The analysis follows:
pulse freq:
roll-off factor:
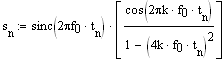
Setup the four bit period pulse and its FFT:
The final pulse:
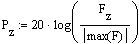
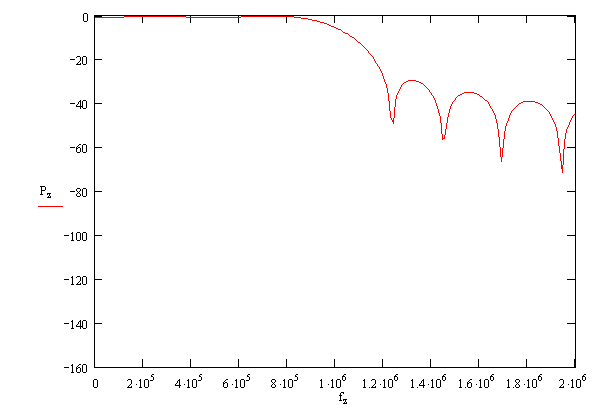
The fft and its power spectrum:
The pulse in the time domain:
The power spectrum follows:
After examining the power spectrum the first null below 50 dB down occurs at 1.454MHz. The bandwidth for the probe signal after mixing will be 2.908MHz
Upconverter, 500MHz Oscillator, and Bandpass Filter
Data sheet:
Miteq BMA0502LA2MD
Data sheet:
Epson EG-2102CA LVDS
The BMA0502LA2MD and EG-2102CA LVDS will mix the baseband signal up to a 2.046MHz bandwidth signal centered at 500MHz. To eliminate the images created by mixing a bandpass filter will be placed after the mixer. Filters are custom made to satisfy the operating requirements. The company
MFC
can provide filter centered at 500MHz with 4.9MHz and 5.1MHz corner frequencies.
Power Amplifier
Data sheet:
Empower BBM1C3K7G
This 5W amplifier will provide the drive for our output antenna. It is will suited for our operating frequency with an operating range between 10MHz and 1GHz.
Monopole Antenna
A quarter-wave monopole will be used to radiate the signal from the probe. The monopole can be made extremely rugged which is important when considering the harsh climate in which the probe will operate. Furthermore, the omnidirectional characteristic of the monopole will eliminate the need for steering mechanisms. The drawback to this antenna choice is the extremely low gain, 5.1dB, and narrow half power beam width, 390.
The monopole antenna will be custom made for the rigors of the Neptuniun atmosphere. The 500MHz center frequency means the monopole will be l/4=.15m long or about half a foot long. The radiating surface of the monopole will consist of the body of the probe.
Probe Characteristic Values
The power transmitted:
The power transmitted in dB:
The gain of the monopole
The half power angle of the mononpole:
Processing Gain/Chipping rate
Transmitted Signal Bandwidth
3.3: Satellite Receiver Communications
Pyramid Horn Antenna
A horn antenna was chosen because it has the gain pattern desired for the operating environment. The probes are all lined up along one line of longitude and therefore gain along one plane would be ideal.
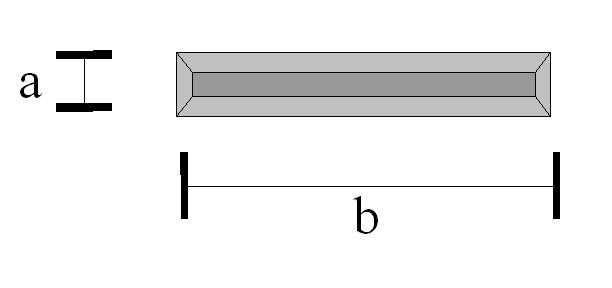
The orientation of the horn will be such that the long side is parallel with the equator of Neptune. The large dimension along the equator will correspond to a narrow beam width along the longitude of Neptune. The short side will have a wide beam width and accept signals that span across several lines of latitude.
The pattern of concern is associated with the side of length a. We want this side to give a half power beam width that will accommodate the probes at 0, 45, and -45 degrees. In
section 2.3
the angle a was calculated that designated this beam width. Therefore, when the 45 and -45 degree probes just enter the atmosphere the half power beam width should be
 . When the probes descend into the atmosphere the angle a decreases and the horn antenna has a stronger gain for angles approaching the axis normal to its aperture. With this in mind we can assume the worst and use the half power gain for all calculations. If these calculations result in adequate signal strength then we have automatically included some safety factor.
Calculating antenna parameters
l= wavelength of reception (m)
n= efficiency of aperture
a= short side of horn (m)
b= long side of horn (m)
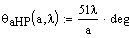
The half power beam width for side a:
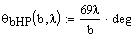
The half power beam width for side b:
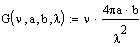
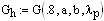
The gain of the horn at 0 degrees:
The length of side a should give a HPBW of 29.4 degrees:
Choose the length of side b to be realistic:
The gain of the horn:
A horn that is 1.04m x 2m at the aperture will give a HPBW of 29.4 degrees along the polar axis of Neptune. The gain at the 45 and -45 degree probes will be 8.82dB.
From the chart seen
here
the temperature of noise seen by the horn at 500MHz is:
Low Noise Amplifier and Bandpass Filter
Data sheet:
EdoCorp Broadband LNA
This LNA will have the following characteristics:
The bandpass filter will be ordered from MFC
and have a center frequency of 500MHz with a 2MHz bandwidth.
Upconverter, 400MHz Oscillator, and Bandpass Filter
Data sheet:
Miteq BMA0502LA2MD
Data sheet:
Epson EG-2102CA LVDS
The BMA0502LA2MD and EG-2102CA LVDS will mix the 500MHz signal up to a 920MHz signal. To eliminate the images created by mixing a bandpass filter will be placed after the mixer. The company
MFC
can provide filters centered at 920MHz with a 2MHz band width.
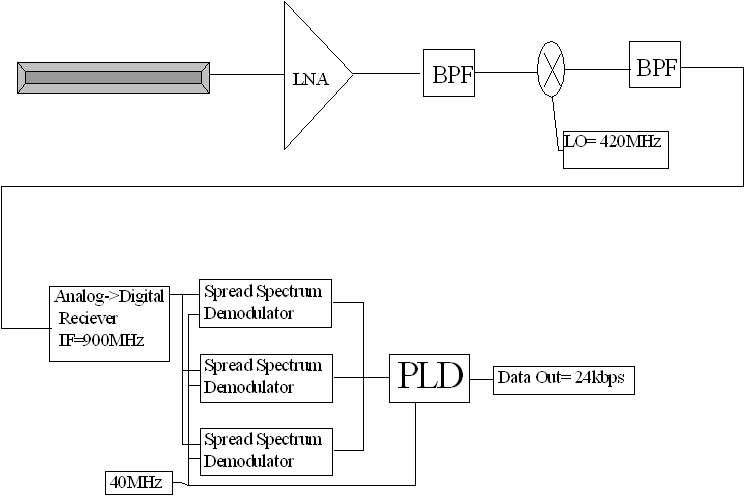
Analog->Digital Receiver
Data sheet:
Comblock COM-3001
This module has a dual band input range of 902-928MHz and 2.025-2.5GHz. The signal being relayed is at 920MHz and will be down converted to baseband and digitized.
Spread Spectrum Demodulator
Data sheet:
Comblock COM-1011
Three spread spectrum demodulators will be used to despread the signals from each of the probes. Each probe will transmit a unique chipping sequence, and these three demodulators will utilize the same chipping sequences to achieve decoding. As an end result three digital data stream will exit this stage of the communications system.
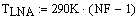
Programmable Logic Device
Vendor List:
Altera
Lattice
Xilinx
The most common programmable logic devices can be broken into two categories, Field Programmable Gate Arrays (FGPA) and Complex Programmable Logic Devices (CPLD). The premise for both devices is the same but both they have strengths and weaknesses. The most important traits:
The task for this section of the communications system is to take the three despread digital data streams coming out of the COM-3001 and merge them into a single stream that can be relayed back to Earth. This process would include providing any additional frame information required to demultiplex the three signals at earth. In all calculations the overhead added by this multiplexing will be assumed to be negligible.
3.4: Link Budget Analysis
The link budget for the transmission of the probes to the relay satellite must now be calculated to verify that the link will be strong enough for error free communications.
The orientations of the antennas must be examined to determine where their gain patterns casting power. The monopole on the probe has a 390 HPBW while the horn on the satellite has already been designed to cover the required area of the surface.
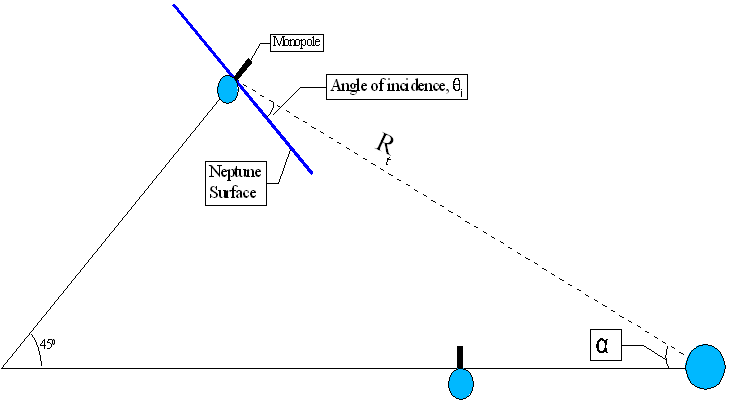
The figure above shows how a probe with a monopole antenna sticking straight out the top of the body relative to gravity will have a beam width equal to the angle of incidence. The assumption has been made that the mechanical characteristics of the probe a such that the probe remains oriented along the axis of decent (baffles, weighted). The worst case angle of incidence has already been calculated as
 which is less than
 , the HPBW of the monopole. If the HPBW of the monopole is used in calculations the performance of the link will be underestimated. Designing the link slightly above the requirements will provide flexibility for any unknowns, but it should not be taken to extremes where it can affect the cost grossly.
The monopole can be mounted vertically on the 45 and -45 degree probes, but the probe at the equator cannot have this configuration. A vertical monopole at the equator would radiate no energy along its axis, and the satellite is overhead in the vertical direction. To eliminate this problem as easily as possible the monopole can be placed horizontally on the probe. This will require two different mounting positions for the monopole.
The link calculation of 45 degree probe at a depth of 420km:
First, the values obtained previously should be recapped:
The probe's HPBW monopole gain:
The power transmitted from the probe:
The HPBW of the relay's horn:
The wavelength of the carrier:
The distance traveled:
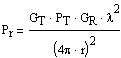
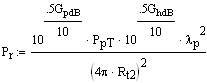
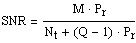
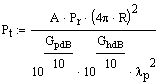
The power received power at the relay is given by:
The received power at the relay from a single probe:
This power represents the spread code that the relay would receive if the atmosphere did not attenuate the signal. Before despreading the attenuation from the atmosphere has to be considered:
The attenuation due to the atmosphere:
The attenuated signal
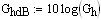
Next the system noise will be calculated
Equation for system noise (see section 1 for constants):
The bandwidth of the transmitted BPSK signal:
For Tsys the gain and noise figure of the low noise amplifier will be the only major contributor:
The noise incorporated into the signal:
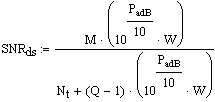
The signal can now be despread assuming all three probe signals are of approximately the same strength. The 45 and -45 degree probes will certainly be equal, but the equatorial probe will have to have its transmission power backed off. First, the despreading:
Number of spectrum users:
The linear equation for despread SNR of a spread spectrum (SS) signal:
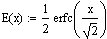
As a final result for the worst transmitting environment a reception of 27dB is attained. To see the probability of getting a bit error the erfc function is used:
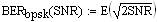
Define the BER function:
Number of bits being sent (probe data rate X time descending):
One out of every
 bits can be expected to be received erroneously. Since a probe will only send 1.475 billion bits there is a large margin of confidence that no errors will occur. Since there is no chance for a second run or communication for error correction this safety margin is reasonable given the scope and expense of the project.
Equatorial Probe compensation
The calculation for finding the despread power assumed that all three probes are transmitting at equal power. To satisfy this condition the equatorial probe will have to back-off on its transmitting power. Another consideration is that this antenna will always be at their full gain angle. The link budget will be calculated with the unknown now being the transmission power. The power received will be set equal to the power received from the 45 and -45 degree probes.
Free space distance:
Desired power received:
The compensating transmission power:
The results show that equatorial probe needs 3000 times less transmitting power at 420km than the two other probes. There are two options for the design at this point:
1. Install a smaller amplifier in the equatorial probe
2. Allow the equatorial probe to transmit at full power after 50 hours
Option 1 will require more hardware configuration control which always adds cost and complications to part inventories. Option two requires more coding in the feedback of the amplifiers, but these changes can be incorporated into all three probes. Option 2 would therefore return more scientific data per dollar spent and is suggested.
.


