Voyage
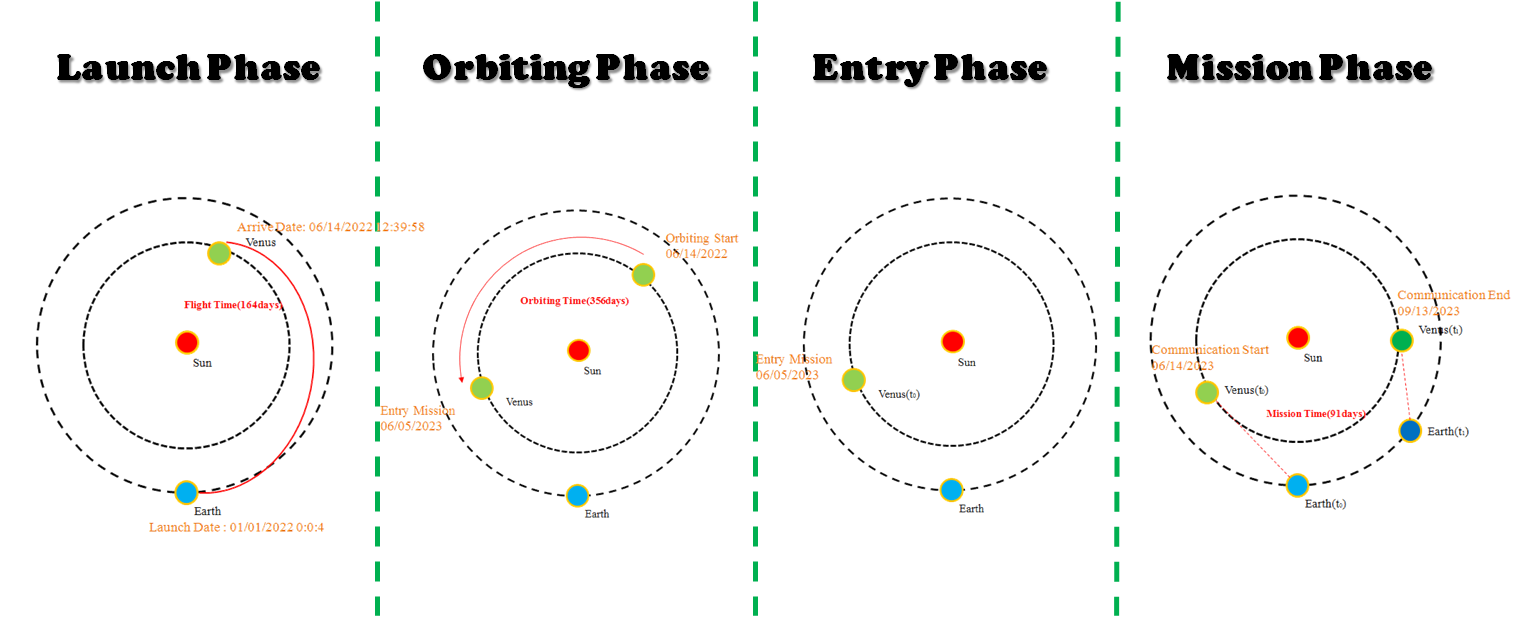
Our mission to Venus is composed of four phases. The first phase is the launch phase. The launch date is 01/01/2022 0:0:04 from Cape Canaveral, and the carrier reaches Venus orbit on 06/14/2022. The next phase is the orbiting phase, the satellite continues orbiting Venus for 356 days until the entry date of 06/05/2023 is reached. The third phase is the entry phase to land the surface systems on Venus. The last step is mission phase to measure vibration level of Venus and send the data back to Earth for 91 days using the Deep Space Network (DSN).
Launch
Trajectory definition of a trip from the Earth to Venus
For defining the trajectory from Earth to Venus, we have performed a numerical analysis to get the optimal trajectory. First, our mission is a two year mission, and the starting date of the entry phase is 06/05/2023. From this result, we determine the constraint that the launch date is from 01/01/2022 to 05/15/2023. Another constraint is that the carrier should arrive in Venus orbit before 05/15/2023. Table 1 summarizes the constraints for the trajectory propagation from the Earth to Venus.
| Constraints | From | To |
|---|---|---|
| Departure date | 01/01/2022 | 06/05/2023 |
| Arrival on Venus | 06/05/2023 |
Trajectory
Based on these constraints, we have done numerical analysis to determine the optimal trajectory, which is minimizing the C3 energy [km2/s2]. C3 is the major parameter to define a launch vehicle system. Minimizing C3 energy means that a launch vehicle system has less propellant. Next consideration is an arrival velocity, because the arrival velocity is a key factor to design the Venus orbit in the orbiting phase. Figure 2 and Figure 3 represent the numerical simulation results describing the arrival velocity and the C3 energy, respectively. In Figure 2, the red line is the mission constraints in Table 1. Our design space for the selection of the launch date is the right side of the constraint line. From these two results, we determine the weights for the arrival velocity and C3 energy to find the optimal trajectory.

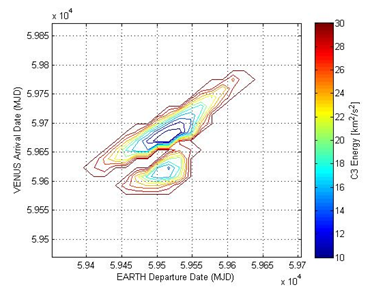
Figure 4 is the result of the numerical analysis for the optimal trajectory. The optimal trajectory is an elliptical orbit, the optimal trip takes around 164 days. Table 2 summarizes the numerical analysis results.

| Orbital element | Value |
|---|---|
| Semi-major axis | 118669856.3712547 km |
| Eccentricity | 0.2408507 |
| Inclination | 3.3821403° |
| Longitude of ascending node | 100.2764005° |
| Argument of periapsis | 175.4581528° |
| True anomaly (start) | 184.4968292° |
| True anomaly (end) | 83.2276012° |
| Departure date | 01/01/2022 0:0:4 |
| Arrival date | 06/14/2022 12:39:58 |
| Arrival velocity | 8.4777km/hr |
| Optimal trip | 164.5277days |
| C3 | 20.0881 km2/2 |
From the optimal trajectory result, the C3 energy is around 20km2/s2. To select the types of launch vehicle, we have used NASA ELV performance estimation curve shown in Figure 3. This figure illustrates that a launch vehicle meeting our C3 energy requirement is only Atlas V(501). The initial total mass is around 4000kg when C3 energy is 20km2/s2. As a result, the requirement for the initial total mass is below 4000kg.

Figure 6 shows the configuration of the launch vehicle. The size of Atlas V is 52.2m and the main diameter is 3.81m. Figure 7 represents the sequence of events for Atlas V.


Orbit
In this section, the method for the satellite orbit during orbit phase is explained. The main design factors in the orbit phase is the required propellant level, the appropriate altitude for the entry mission to reach the target point on Venus, and the geometric information of the landing site. The required propellant level is determined dependent on the altitude. In the launch phase, the final velocity can be calculated from C3 energy which is 20km2/s2 [35] . The equation for the final velocity is seen in Equation 1.
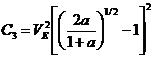
In Equation 1, a is the semi-major axis and VE is the initial speed. From this equation, the required ΔV is 90.06 m/s. In the next phase, carrier has to enter an elliptical orbit. The elliptical orbit is selected based on the landing points. The method defining the landing site will be explained in the entry phase section. Our selected landing site is latitude of -7.6 and longitude of 303.5. From this condition, we can build the constraint that the elliptical orbit should have a minimum altitude around the landing site because in the entry phase, using a fast velocity is more efficient. Hence, perigee point of the elliptical orbit should be located near landing point to get a higher speed (from the definition of Kepler’s law). The other constraint is that the required propellant should be minimized. In other words, maximizing the apogee is more effective to reduce the required thrust. From these conditions, the selected orbit elements are seen in Table 2.
| Orbital element | Value |
|---|---|
| Apogee | 40000km |
| Perigee | 300km |
| Inclination | 85° |
| RAAN | 30° |
| Revisit time | 12hour 59min 16sec |
Using this orbit information and the arrival velocity (8.4777km/h), we can estimate the required ΔV to be 2846.88 m/s. Figure 8 illustrates the orbiting phase. After reaching the elliptical orbit presented in table 2, the orbiter continues to orbit for 356 days before the entry phase.

Entry
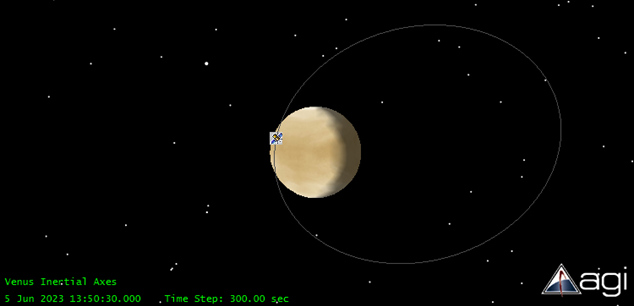
The main constraint to select the entry time is the landing point and the mission starting time. Landing site is LLA (-7.6°, 303.5°). Based on these constrains, we determine the entry event time. The entry time is 06/05/2023 13:50:30. Figures 9 and 10 represent the location of satellite at entry time.
Before the entry phase, the last communication of the orbiter is with the Madrid DSN station. Figure 11 shows the communication before the entry event.

Deployment
The key requirement in the mission phase is for the communication time to be 90 days.
The key requirement in the mission phase is for the communication time to be 90 days. The data of seismic sensor needs to be send to the DSN Earth stations. There are three locations, Goldstone, Madrid and Canberra. Table 3 shows the longitude and latitude of the three stations and figure 12 illustrate their location.
| Station name | Latitude | Longitude |
|---|---|---|
| Goldstone | 35.4267° | -116.89° |
| Madrid | 40.4314° | -4.2481° |
| Canberra | -35.4014° | 148.982° |

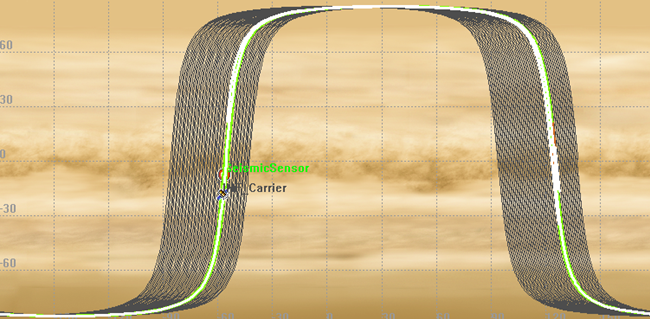
To find the landing site, we analyzed the possible mission date based on the variation of latitude. So, the latitude is fixed, longitude is 3° and the latitude is changed to see the the variation of communication duration between lander and DSN. Azimuth and elevation angles are not constrained. Table 4 shows the analysis results. The location near the pole can get more access time with Earth stations. Next, we performed the look angle calculation, because the surface of Venus is not flat. Therefore, the elevation constraints are necessary for a stable communication link. Figure 13 is the outputs when the latitudes are near poles and near equator. The look angle graph shows that, at the pole, the look angle of the antenna is below 5 degree. So, it’s almost impossible to keep the data link with Earth stations.
| Latitude | Longitude | Access time | Days |
|---|---|---|---|
| -90° | 3° | 02/18/2023 ~ 07/01/2023 | 134 |
| -70° | 3° | 07/01/2023 ~ 10/19/2023 | 111 |
| -50° | 3° | 07/01/2023 ~ 10/19/2023 | 111 |
| -30° | 3° | 07/01/2023 ~ 10/19/2023 | 111 |
| -10° | 3° | 07/01/2023 ~ 10/20/2023 | 112 |
| 10° | 3° | 07/01/2023 ~ 10/20/2023 | 112 |
| 30° | 3° | 07/01/2023 ~ 10/20/2023 | 112 |
| 50° | 3° | 07/01/2023 ~ 10/20/2023 | 112 |
| 70° | 3° | 07/01/2023 ~ 10/20/2023 | 112 |
| 90° | 3° | 07/01/2023 ~ 11/07/2023 | 130 |

Next, we defined the constraints of elevation angle to be 20° (see here). Then, we analyzed the possible mission duration. Table 5 shows the simulation results. The results indicates that in order to maintain 90 days of direct communication, the latitude should be between -30 and 30.
| Latitude | Longitude | Access time | days |
|---|---|---|---|
| 10° | 3° | 07/12/2023 ~ 10/12/2023 | 93 |
| 30° | 3° | 07/13/2023 ~ 10/10/2023 | 90 |
| 50° | 3° | 07/17/2023 ~ 10/07/2023 | 83 |
| 70° | 3° | 07/30/2023 ~ 09/26/2023 | 59 |
| 90° | 3° | 0 |
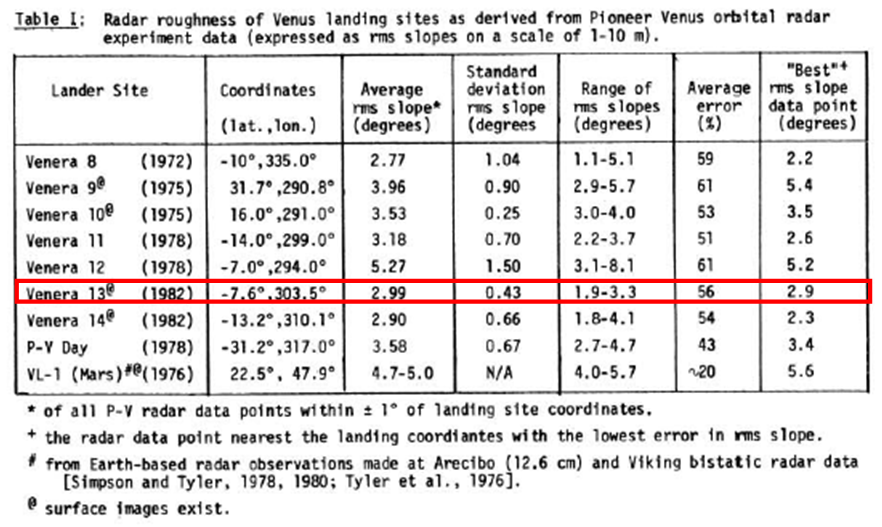
The next considertation for landing site is the landing surface of Venus. Table 6 describes the slope of the Venus landing sites [30]. From this list, we selected the landing site whish has low slopes and satisfy the latitude requirement to keep 90 days of communication. Figure 14 is more detailed information about the landing site flatness [31].

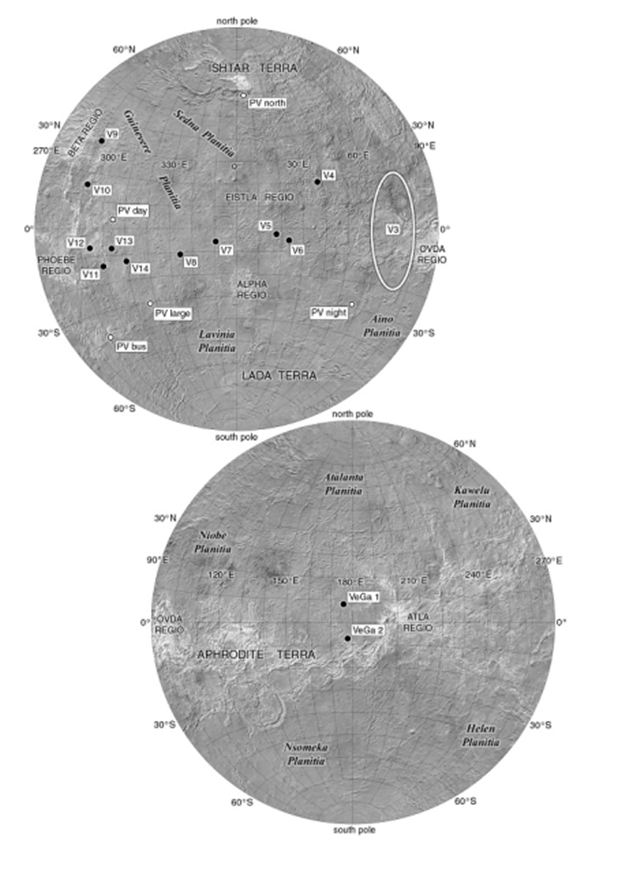
From this information, the landing site is selected. Also, to calculate the possible mission date, performance needs to be analyzed. The communication access time between the lander and Earth is 91 days. This results satisfies our mission requirement. Table 8 summarizes the selected landing site. Figure 15 shows the actual landing location on Venus planet. In the figure, our location is V13.
| Latitude | Longitude | Access time | Days |
|---|---|---|---|
| -7.6° | 303.5° | 06/14/2023 ~ 09/13/2023 | 91 |
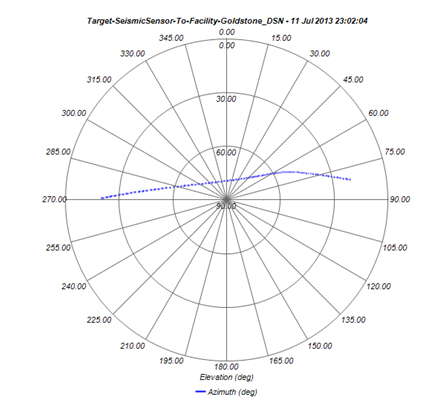
Next, the analysis of look angle and distance between DSN and the lander on Venus is performed. Figure 16 represents the analysis results. The time of closest distance between Earth and the lander is around 08/10/2023. During the mission phase, the azimuth angle is from 80° to 270°, and the elevation angle is in the range from 20° to around 80°. Figure 17 also shows the polar plot for antenna look angle of lander. Figure 18 summarizes the mission phase.